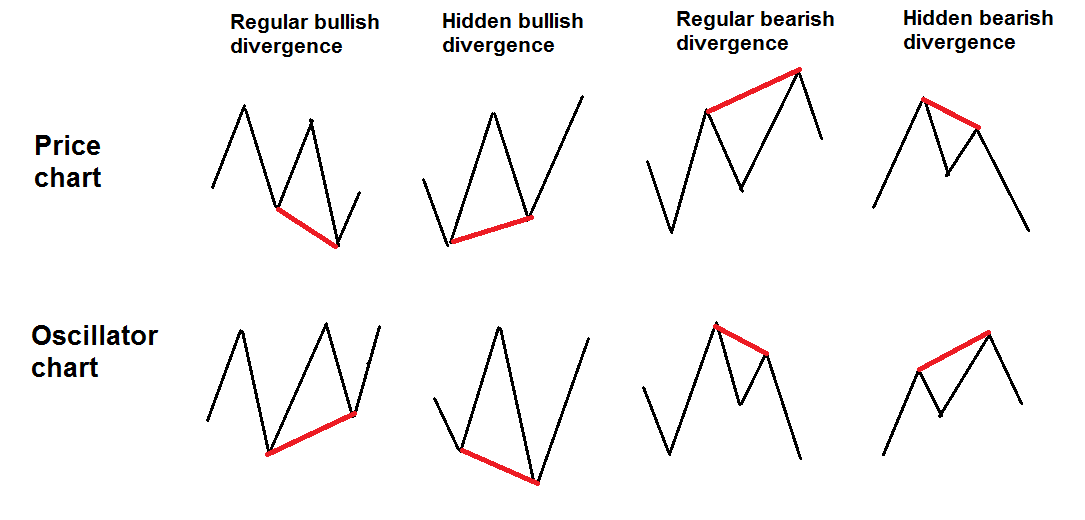
Types of Forex Divergence
There are four types of divergence:
-
Regular bullish;
-
Regular bearish;
-
Hidden bullish;
-
Hidden bearish.
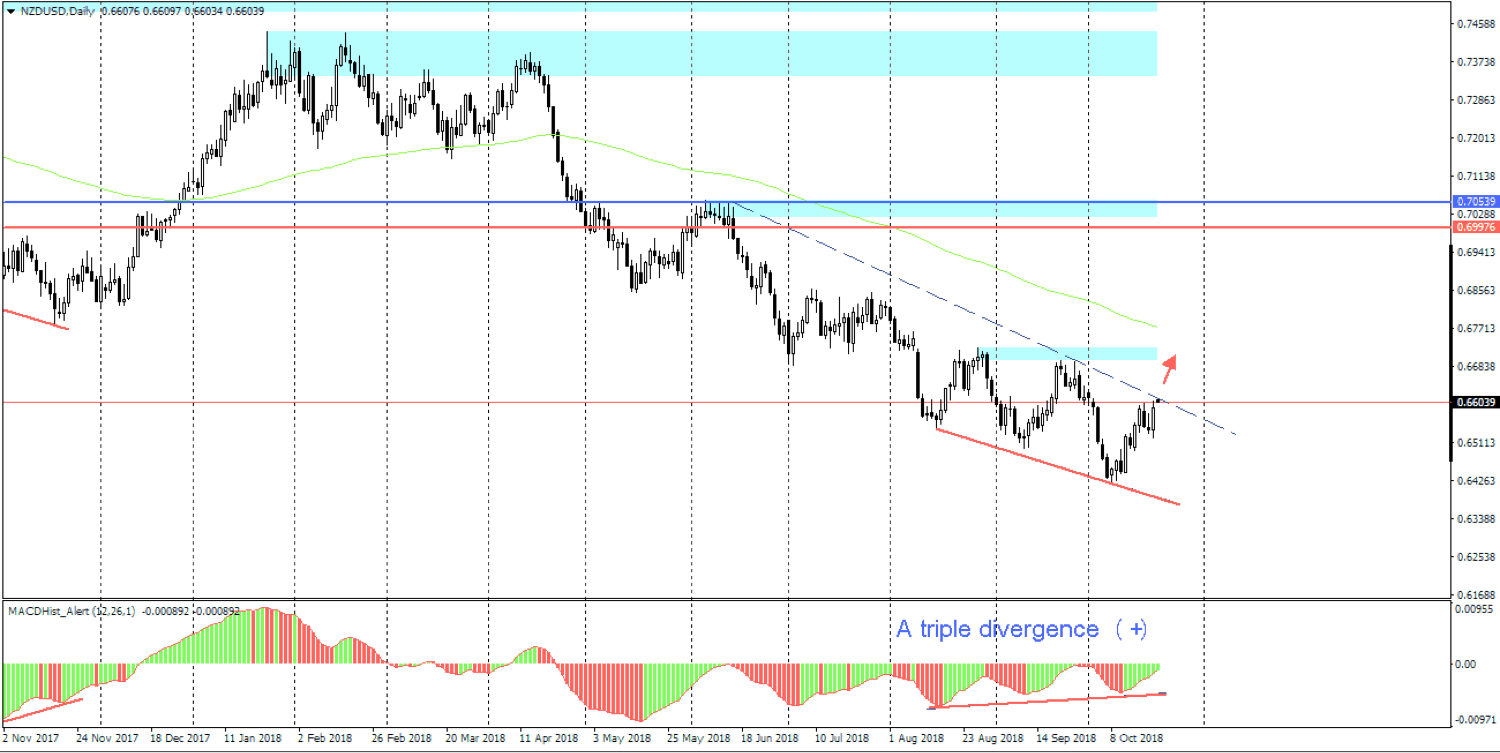
Usually Forex traders use such divergence model as a double/triple top. For example, in an uptrend a situation can occur, when three or four higher highs on price chart correspond to three or four lower highs on oscillator chart. Conversely, on a downtrend of three or four lower lows on price chart, there are three or four higher lows on the oscillator chart. Such situation is called a triple or quadruple regular divergence. It indicates weakness of the current trend and a potential reversal. If you find a divergence, you should maintain you entries accordingly: either close your positions or move stop loss order closer to current price. Hidden divergence is mostly used for developing trend determination and analysis. It can show you the perfect moment for entering the market in a trend direction. As a rule, if there is a hidden divergence, then the price moves either to the last minimum or last maximum, which a trader can use as a perfect entry point. However, if the distance between the potential entry point and the last minimum/maximum is rather small, it’s better to wait. When a hidden divergence is formed, please pay attention to the third (forth) highs and lows. If you spot the correct divergence formation at the third high (for uptrend) or low (for downtrend) in hidden divergence, it is better to wait. A similar signal indicates likely a trend reversal.
Due to the fact that regular divergence is easier to spot and simpler to interpret, most traders are not using the hidden one. On the other hand, a combination of regular and hidden divergences allows you to get more accurate signals and improve your trading performance.
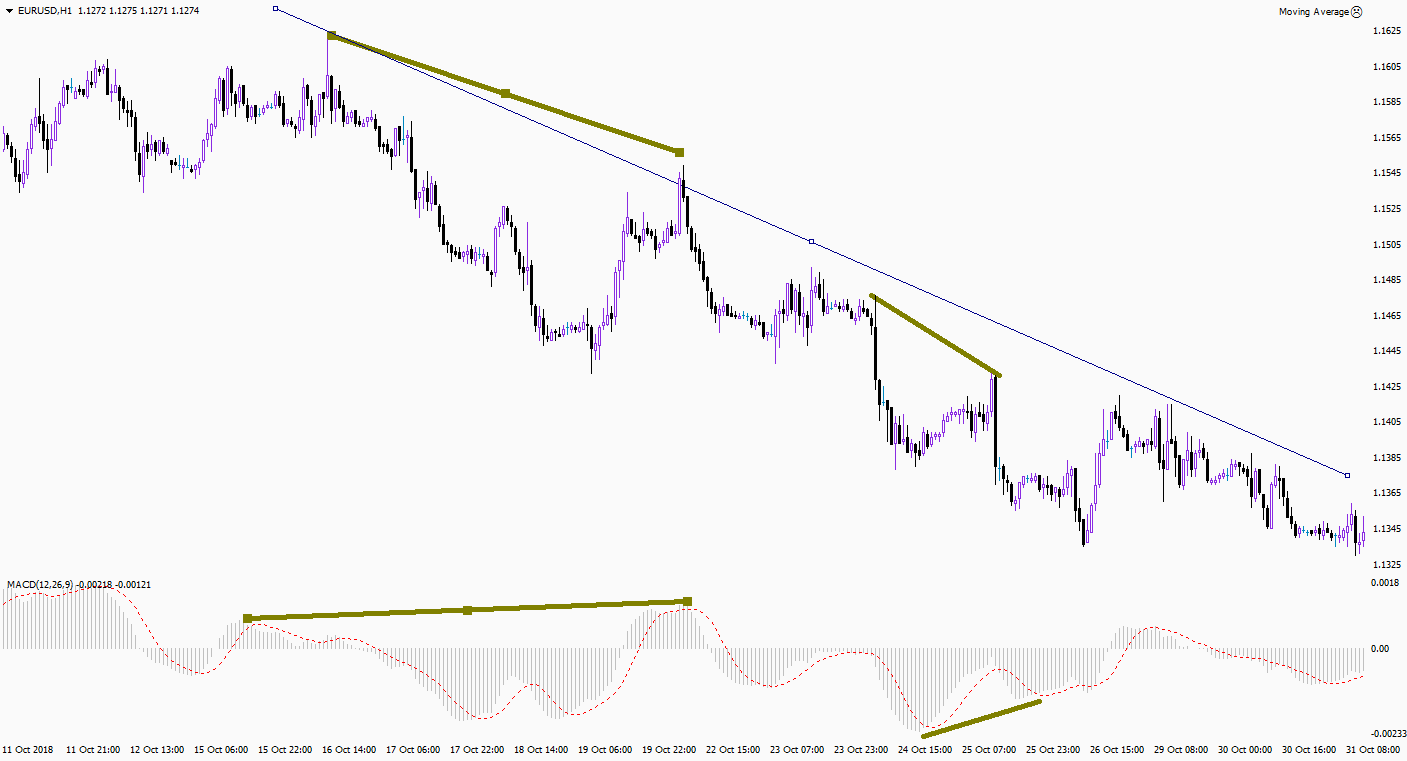
The Use of Forex Divergence
Forex divergence can also be formed on a flat market. During this time period, previous minimums and maximums of flat range are tested. The chart below illustrates how the trend line helps to determine divergence. When two minimums appear, a trend line can be plotted and extended over the entire length of the chart. When price comes close to trend line, it is necessary to pay attention to the oscillator, since at this moment, a hidden divergence can be formed. You can clearly see that there is a hidden divergence (olive line). Please pay attention to the situation, when the price comes close to the trend line (Oct 23rd). At that time the regular Forex divergence appeared (second olive line on MACD). It signals that the hidden divergence in this situation can no longer be used and there is a possibility of a trend reversal.