What is a moving average?
The simplest form of a moving average is calculated by taking the arithmetic mean of a given set of values. MAs are always represented on the price chart. It can be built for any period of time, whether 5 minutes, 1 minutes, days, weeks or months.
Different types of SMA
Moving averages are constructed from closing data of the currency pair, but it can also be constructed from the following price data sessions:
MAs from closing prices: For its construction, chart is prepared by taken only the closing prices of the session whether daily, weekly, monthly, etc.
MAs from high prices: Considering the high prices of each session for its construction.
MAs from low prices: Considering the low prices for each session for its construction.
MAs from pivot points: Pivot points are calculated as p= (H+L+C)/3, and it is used as an important reference point in technical analysis. However, pivot points can also be used to construct MAs.
Additionally, there are many other parameters like open, volume, RSI, stochastic that can be used to construct popular MAs.
Role of SMA in Determining Forex Market Trends
Moving average can be utilized to determine currency trends. For example, if the MA is rising, then the trend is considered up while if the MA is falling, the trend is down. The following method is also helpful to determine trend in a simplest way and it can be clubbed with rising and falling SMA technique.
-
For shorter-term SMA, you can use 5, 13 and 20 day time periods. Whenever prices of the pair are closing above the 20 day SMA, it is generally considered that the short term trend is up and a close below the 20 day SMA, we say the short term trend is downwards.
-
For the medium term SMA, we can use 34, 50 and 65 day time periods. Whenever prices of the pair close above the 50 day SMA, the mid-term trend is considered to be up and vice-versa.
-
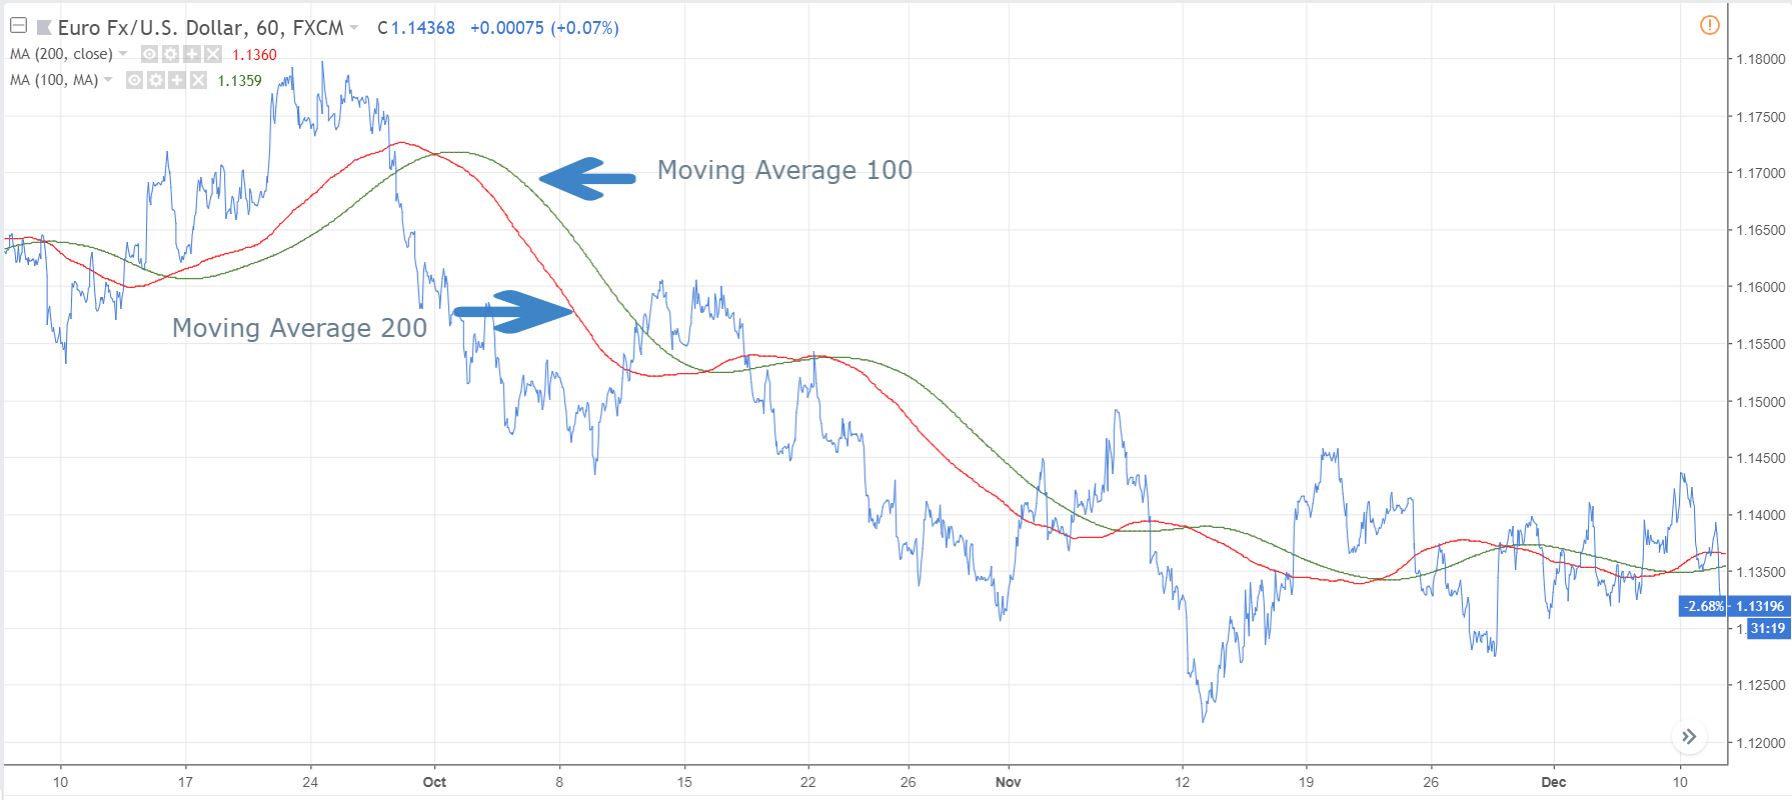
For the longer term, 100 and 200 day time periods can be used. Whenever prices close above the 200 day SMA, the long term trend is considered to be upwards and vice-versa.
Moving Average Crossover
When the shorter MAs crosses above the long-term MA, it signals the trend is shifting up and creates a buy signal. And, when shorter moving average crosses below the long-term MA, it shows the trend is shifting down and creates sell signal. A bullish crossover of the 50 and 200 DMA is known a “golden crossover”, which is the most popular crossover among the forex traders. A bearish crossover of the 50 and 200 DMA is known as “death crossover”, which is considered as a strong bearish signal. The simplicity of MAs makes it popular among Forex traders. It does not work well in choppy or sideways market conditions. It is advisable to not to use shorter or medium term MAs during that period.