The Significant Fibonacci retracement percentages
The most significant Fibonacci retracement percentages are 38.2 percent, 61.8 percent and 76.4 percent. Most trading platforms contain an automatic Fibonacci retracement drawing tool. Although price action often exceeds the exact price action level where the Fibonacci point, it is very common for reversals to occur shortly after. Sometimes several price bars of consolidation are required before changing trend direction, while in other instances, 2 or 3 price bars are enough to completely reverse and validate the new trend. The 61.8 percent is probably the most popular Fibonacci retracement percentage that is used by technicians.
How to Use Fibonacci Sequence?
The ratios that are used in Forex trading utilize this ‘Golden Number’ and also use the additional stages of this ratio. These additional stages are 23.2%, 38.2%, 50.0 % and 61.8%. 0.0% is the reference of the low of a move while the end of the move is identified as 100.0%. By using such levels in Forex, traders are able to project price contractions and extensions inside the market. Here are some general facts needed to know when using the Fibonacci strategy in Forex trading:
-
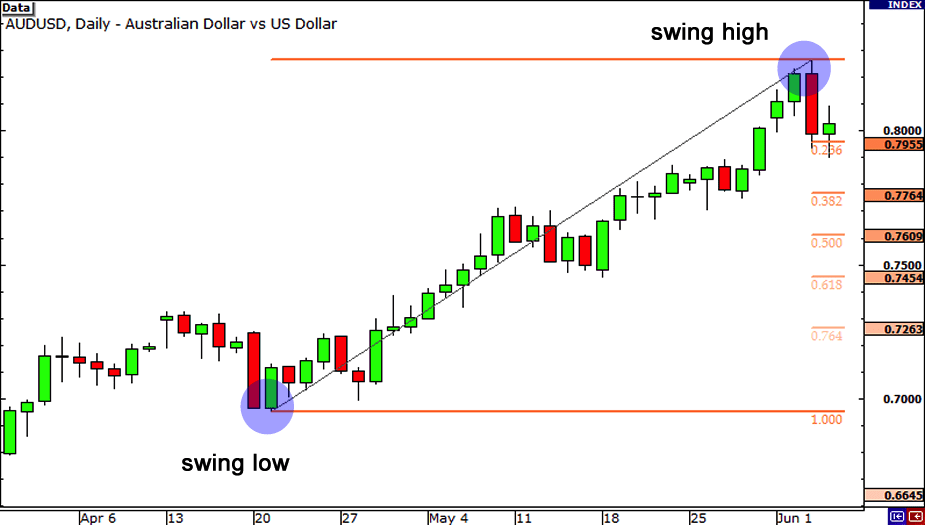
A Swing High is the highest point on the graph in the timeframe that the trader is concerned about.
-
A Swing Low is the lowest point on the graph in the timeframe that the trader is concerned about.
-
In Forex, the ratio numbers are placed between a Swing High and a Swing Low whether it’s on an uptrend or a downtrend. They signify support and resistance levels for a trend to take. After plotting the ratio, the results that appear on a chart are named a ‘trace’.
2 Types of Fibonacci Traces
The two types of Fibonacci traces are Fibonacci Retracements and Fibonacci Profit Targets.
-
Fibonacci Retracements: These levels identify for a trader the lowest places to buy when a trade is moving up in value. In general, Retracements are mini support levels.
-
Fibonacci Profit Targets: This is the highest expected level a trade is anticipated to reach. Profit Targets are a form of mini resistance levels.
Note:
-
Fibonacci Retracements are charted with a Swing High and a Swing Low. By choosing both, the charting software ends up processing all the work for the trader.
-
Fibonacci levels. As a new trader it is best advised that the directional move is 25-30 pips or perhaps more. He/she should also buy on the 50% or the 61.8% level.
-
Fibonacci Profit Targets are commonly placed above the Retracement levels. Traders usually pull out of a trade at mini resistance levels.
-
Combining the Fibonacci trading system with further indicators and oscillators produces more efficient and accurate results.
-
If 10-15 pips are risked on a specific Fibonacci trade, traders receive 40-50 pips in return and they sometimes leverage this to generate more funds.