
Excerpt: Learn the basics of cryptocurrency technical analysis with Forex4you’s tutorial. Dive into the different types of analysis and learn how to use it to trade your favorite cryptocurrency.
Cryptocurrencies are another asset class with huge potential for traders to diversify their investments and maximize profits. Over the years cryptocurrency trading has gained huge tractions as traders can now make profits from up and down price movement. When it comes to trading, there are two main methods of analysis that are very popular with traders and investors - technical and fundamental analysis. These two methods also apply to cryptocurrency trading. Fundamental analysis determines the value of a cryptocurrency by studying and analyzing the important variables and metrics that reveal vital information about the crypto project in question. This helps to evaluate the prospect of the cryptocurrency to help a trader decide whether it is worth investing in. In the crypto world, fundamental analysis is often used by long-term investors, who intend to buy and hold for a very long time. This crypto trading strategy is also referred to as HODL. Technical analysis, on the other hand, analyzes the historical price data, in order to predict the near-term and long-term price movement of the cryptocurrency. Traders and investors use technical analysis for short-term and long-term decisions.
Crypto Technical Analysis: What is It All about?
Technical analysis studies the historical chart of an instrument and identifies repetitive patterns. The underlying principle of this methodology is that a crypto price already reflects everything there is to know about it. All the fundamentals, sentiments and other information are already represented by price actions represented on the chart of the crypto. Technical analysts/ crypto traders, therefore, focus on price charts and depend on this for their information. For a beginner, this might be complicated at first. Technical analysis of a crypto currency is mainly based on three assumptions;
The market discounts everything
Price moves in trends
History tends to repeat itself
Similar like trading Forex or stocks, crypto traders can make use of mathematical indicators, oscillators and drawing tools that help them making trading decisions.
Types of Technical Analysis: Charting lines, Support & Resistance, Price Patterns
Crypto traders or investors, who use charts are called chartists. Often, chartists draw horizontal or diagonal lines to identify levels or points where the price of an asset could react. The three major lines used are trendlines, support and resistance lines.
Trendlines
These are diagonal lines that identify a trend. When the trend is still ongoing, trendlines can be plotted from two points along with the trend and then is projected to the future. Often when the crypto price comes close to the trendline, it reacts in two ways. If it bounces off the line, the trend will very much likely continue, but if it breaks the trendline in the opposite direction of the trend, this means that the trend will pause, get weak or there would be a counter-trend move.
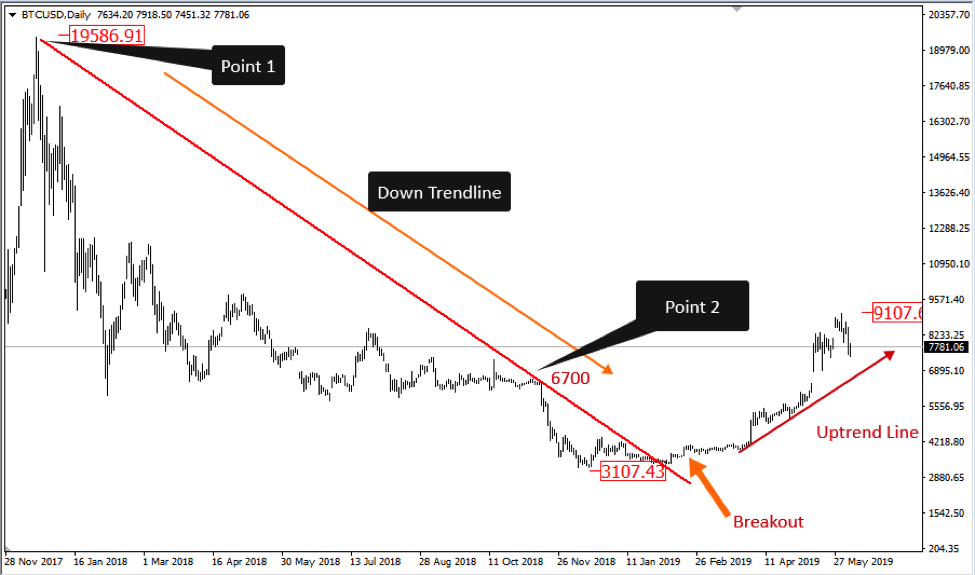
The chart above shows an example of the Bitcoin USD pair, trading on a daily time frame. You can see from the chart, when Bitcoin price fell in 2018, the price chart provided two points to draw a down trendline - 19586 and 6700. The trendline was projected to the future to help identify where price could return upside. The downtrend lasted for a year before the breakout in January 2019. Since the breakout, the downtrend stopped and price went upside. On this same principle, a trendline is also drawn for the current uptrend. If price breaks below the trendline, Bitcoin price could continue to 5000 or even below.
How to use Support and Resistance Lines?
A crypto price is believed to have a memory. If buyers were unable to take price beyond a particular level in the past before the sellers took over, that level is called RESISTANCE level. In other words, resistance levels happen at a point where supply outdo demand for an instrument. A support level occurs when the demand outdoes supply, and price is pushed up. Chartists often identify these levels with horizontal lines and believe that price could react when it comes near in the future. There can be many resistance levels above the crypto price and many support levels below. If a resistance level is broken to the upside, price is expected to move toward the next one while the once broken resistance level becomes a support level. The same school of thought applies to support levels. A support level broken to the downside turns into a resistance and price can dig further until it gets to the next support level. Support and resistance levels also provide reversal zones for the price.
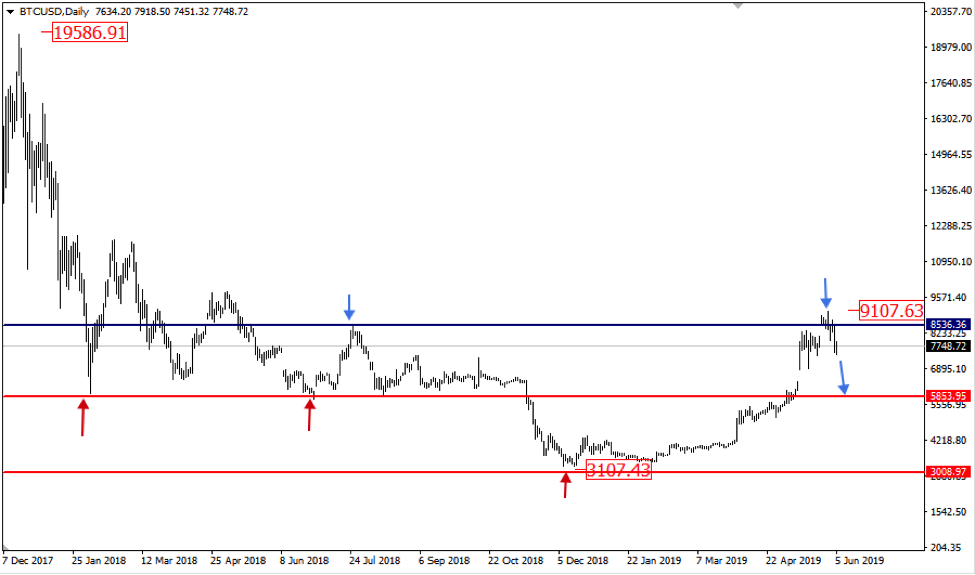
The chart above shows Bitcoin trading against USD, on a daily timeframe. After the bearish trend in 2018 gathered momentum, price pushed back at 5800 in early February (first red arrow). In late June and mid- August, price retested 5800 and was still supported. This price level became a strong level of support and many believed at that time that Bitcoin would hit 3000 (came back to that level and bounced again.
If we go back in time, 3000 was once a resistance level formed on 8th June 2017. After the 4th August 2017 breakout, the level was retested on 15th September but remained a support level and price burst upside to hit higher levels. 3000 therefore became the next support level below 5800. When price eventually broke below 5800 in mid-November 2018, it continued downwards to 3100 (very close to 3000). Bitcoin price has not looked back as it broke the first resistance 5800 (support turned resistance) and hit slightly above the next resistance at 9100 late July 2018 (formed in late July 2018). At the current price level, chartists will expect Bitcoin to come close to test 5800 (now a support level). If it breaks below, next support is 3100-3000. However, if 9100 is bridged, BTCUSD price could continue to the next resistance levels at 9800 and 11700.
Why traders should study crypto price patterns?
Over many decades, after thousands or perhaps millions of hours studying price charts, chartists have discovered that price exhibit patterns and these patterns are repetitive over time. If price reacted in some way to a price pattern in the past, why shouldn’t it react the same way in the future. After all, activities of market participants determine the price of an instrument. Humans often react to situations in similar manner and this could carve out a behavioral pattern. The mass behavioral pattern of traders and other market participants also give the price its own behavioral pattern. These patterns are also applicable when trading crypto. Some of these price patterns include candlestick and bar patterns, chart patterns like triangles, flag, harmonic patterns, Elliott wave patterns. There are a good number of price pattern methodologies out there. An example given below, deals with the triangle pattern on Bitcoin, let’s study this price pattern more thoroughly.
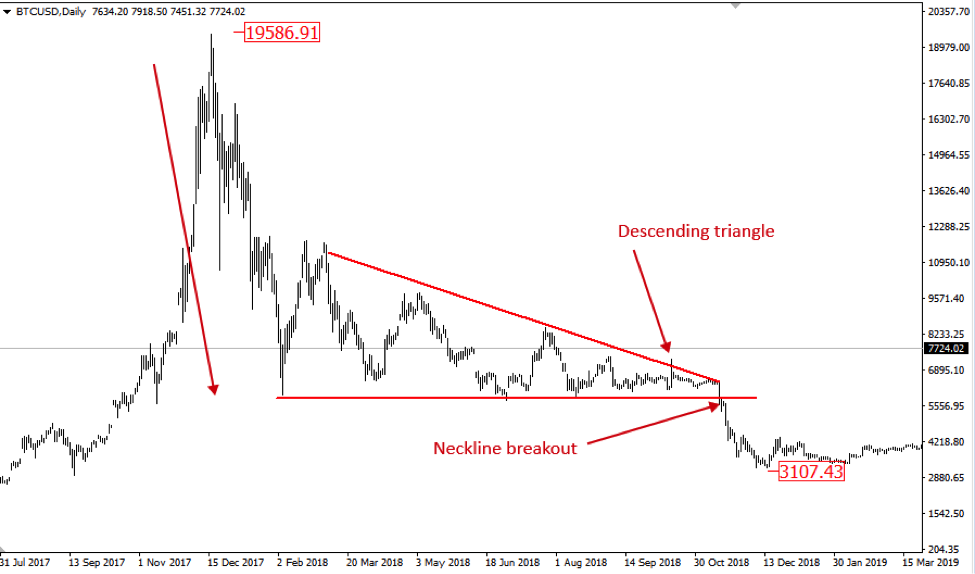
From the BTCUSD daily chart above, we can see that Bitcoin completed a 10-month triangle, which started in February. The direction of breakout is believed to be near-term direction of the asset. After the downside breakout, Bitcoin eventually hit 3100, which confirms the expectations of the triangle pattern.
Using Indicators and Oscillators to trade Crypto
Indicators are technical tools that are based on mathematical computation of historical price and/or volume to help provide buy and sell signals or predict the next market move. They can help study price charts in a way that’s much more easier to work with. Some of these indicators help to identify trends - uptrends or downtrends. Some indicators are used to identify whether the crypto is overbought or oversold. With the advent of high level trading, many indicators have been developed to serve different purposed. The major types are outlined below.
Trend following indicators for Crypto trading
Trend following indicators help to identify the prevailing trend in any time frame. An example is Moving Averages, showed in the example below. From the chart below you can see that in January 2017, Bitcoin price crossed the 100 Exponential Moving Average, this indicated that an uptrend would follow. This did happen, and the uptrend continued throughout the year.
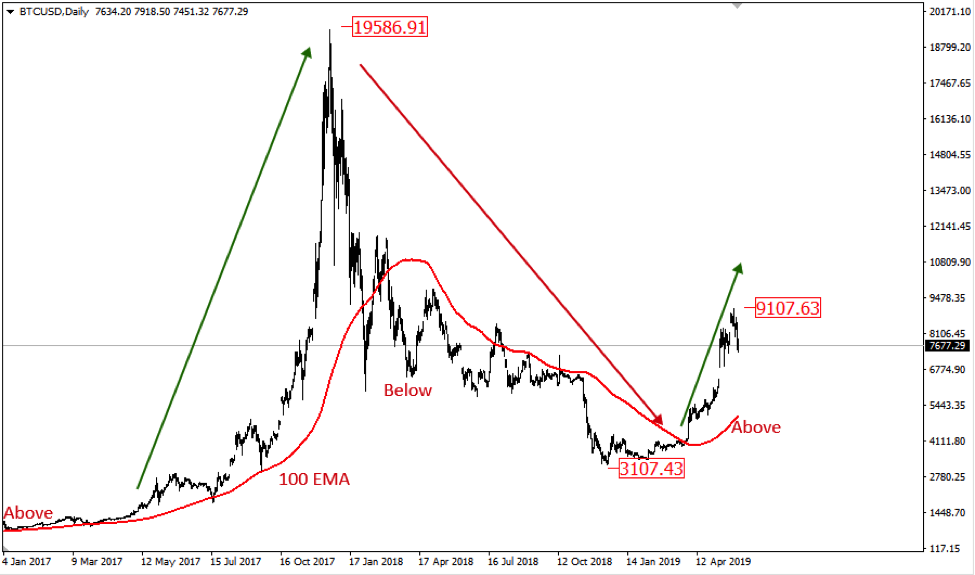
In 2018, the indicator lagged, but once price dropped below it, the downtrend continued to 3100. The indicator also identified the end of the downtrend and the beginning of a new uptrend started after Bitcoin price crossed above the Moving Averages line in April. So it’s no surprise that many believe that Bitcoin will be bullish again throughout the remainder of 2019.
Oscillators for crypto trading
Oscillators are usually indexed from 0 to 100. When these indicators read 25 or below, the crypto under watch is considered oversold and could start moving up. On the other hand, a reading of 75 or above indicates overbought and the crypto could start going downside. Types of oscillators include Relative Strength Index (RSI), Moving average convergence divergence (MACD), Stochastic oscillator and many more. In the chart below we take a look at the Relative strength Index on the BTCUSD daily chart.
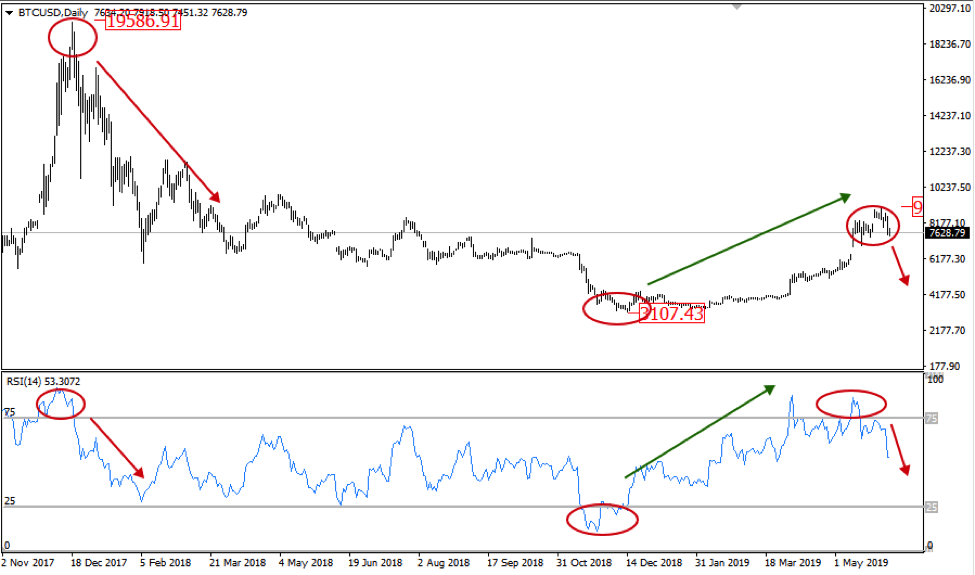
In late 2017, you can see that the RSI oscillator crossed the 75 index, it was a signal that Bitcoin could start falling. The next move that followed was a wild fall. In November/December 2018, the RSI also reached the oversold zone and indicated that Bitcoin could go up. Bitcoin has been on the upside since then. In late May 2019, Bitcoin touched the overbought zone again and price got weakened, again it was indicated by the RSI oscillator.
Volume-based indicators for crypto trading
Volume-based indicators are used to determine the direction of an instrument and the strength of price change. An example is the On-balance Volume (OBV).
Tips for Crypto Technical Analysts
Trading with technical analysis is easy on the paper with cherry-picked examples, but the truth is that they are not easy to apply and are not perfect. Crypto traders need to understand this fact and not raise their expectation or get over-excited. These trading tools and methodologies are all parts of analysis that help identify entry and exit points for crypto trading and investing. To make an effective use of technical analysis, crypto traders can use the following tips.
Learn a trading methodology or develop one from the combination of the tools discussed above. Thus, you will need to understand these tools first and do a thorough study of the tools. Your trading system must give clues on how to enter, where to take profit and set stop loss. Each technical tool has its own pros and cons. On one hand, trend-based indicators follow the trend, but they often lag. On the other hand, oscillators are leading indicators, which may move sometimes while price stays sideways or continue the prevailing trend
Test the technical methodology learnt and gain experience by utilizing the chosen tools for a year. Identify the win/loss ratio and associated risk/reward ratio. If it is sustainable, you can go ahead if not, it should be dropped. For example, a sustainable system should give at least 30% winners on at least 1:2 R/R, or at least 60-70% winners on 1:1 R/R on a sample of at least 100 past trades.
Write down your methodology and develop a trading journal that helps track your current performance.
Whether you win or lose a trade, it doesn’t matter. Move to the next. Winning traders and Losing trades are all part of the bigger picture.
Stay disciplined and maintain a healthy risk profile.
Other Important Things to know about Crypto Technical Analysis
Past trends or results may not accurately predict future trends or results.
It’s impossible to know which trades will win or lose before hand.
It’s normal to have consecutive losses or wins.
Winning and losing trades have a random distribution in a set of a large number of trades.
Do you have any questions about the technical analysis basics for crypto traders? If yes, please share you comment below and we will get back to you. For more education on crypto trading or Forex, visit Forex4you’s website to get all the courses, tutorials, trading tools and more.