The Head and Shoulders Pattern
The Head and Shoulders pattern is formed by three consecutive peaks. Side peaks are shoulders, and the middle one is the head. Between those peaks there are local minimums, which form support level. This level is called "neckline" of the Head and Shoulders model. On the chart below you can see a classic example of the Head and Shoulders reversal pattern. You can clearly see the main components: two shoulders a head, neckline, which acts as support level before breakout and as resistance level afterwards.
The Head and Shoulders is trend reversal pattern. If it is formed on bullish market, traders should expect trend to become bearish. If trend is bearish the Inverse Head and Shoulders can be formed, which would give traders a sign for potential trend reversal. The pattern itself does not only signal you that trend is changing, but also provides you an opportunity to trade. The simplest way to trade the Head and Shoulders is to sell after the second shoulder was formed (or buy in case of the Inverse Head and Shoulders). Take profit target is calculated the following way: you deduct neckline level from head peak. You put take profit level for the calculated amount of pips from the neckline level. If you’d missed the opportunity to enter right after price broke neckline level, wait for the retest of this level some time later.
The Double Top and the Double Bottom Formations
Double tops and bottoms are one of the most popular, profitable and easily applied patterns known by Forex traders. The Double bottom pattern looks like letter “W” and the Double top is similar to letter “M”. The idea behind these pattern is very similar the head and shoulders, but instead of three peaks those models have only two.
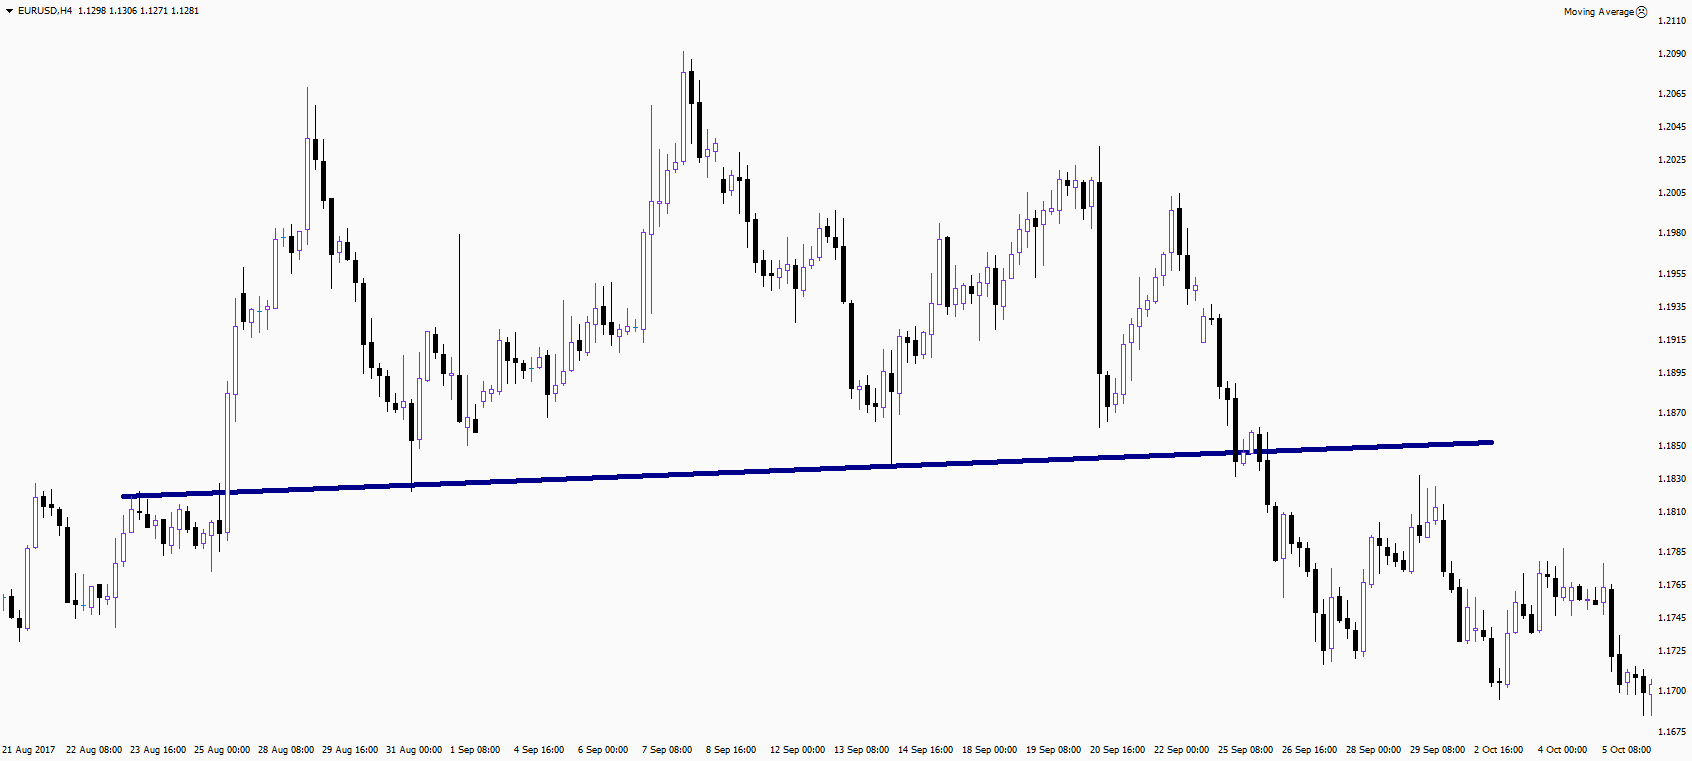
The Double Top
is a bearish reversal patter, which forms on an uptrend. Price fails to break significant support level. Tops are approximately the same height. But there should be an increase in trading volumes when the first peak is formed. Basically traders wait for breakout of the support level after the second peak and then start to open sell entries.
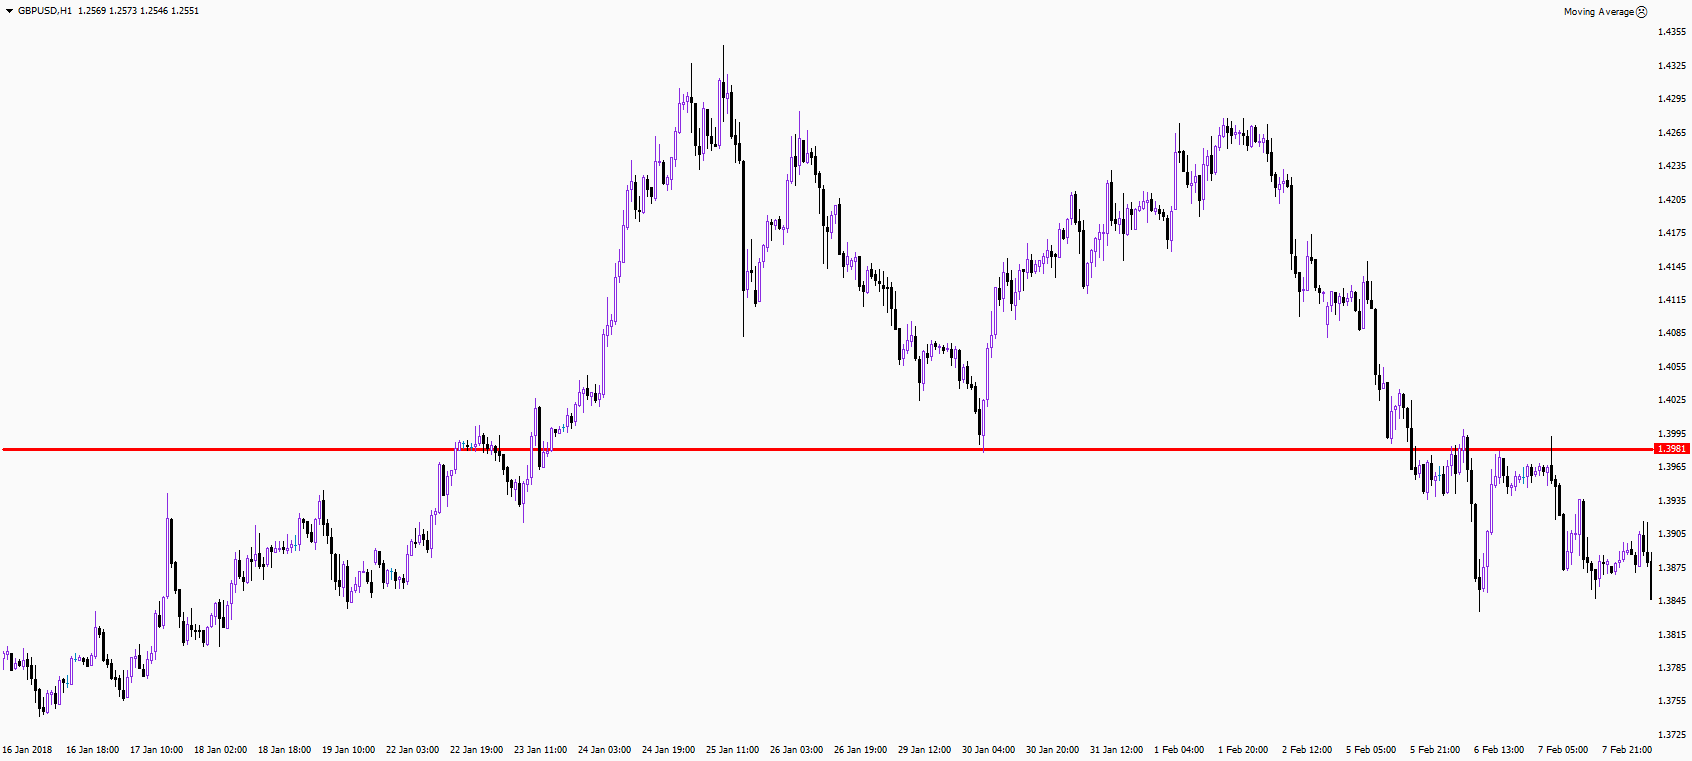
The Double Bottom
is a bullish reversal pattern. It looks like a mirror image of the Double top pattern and works exactly the same.
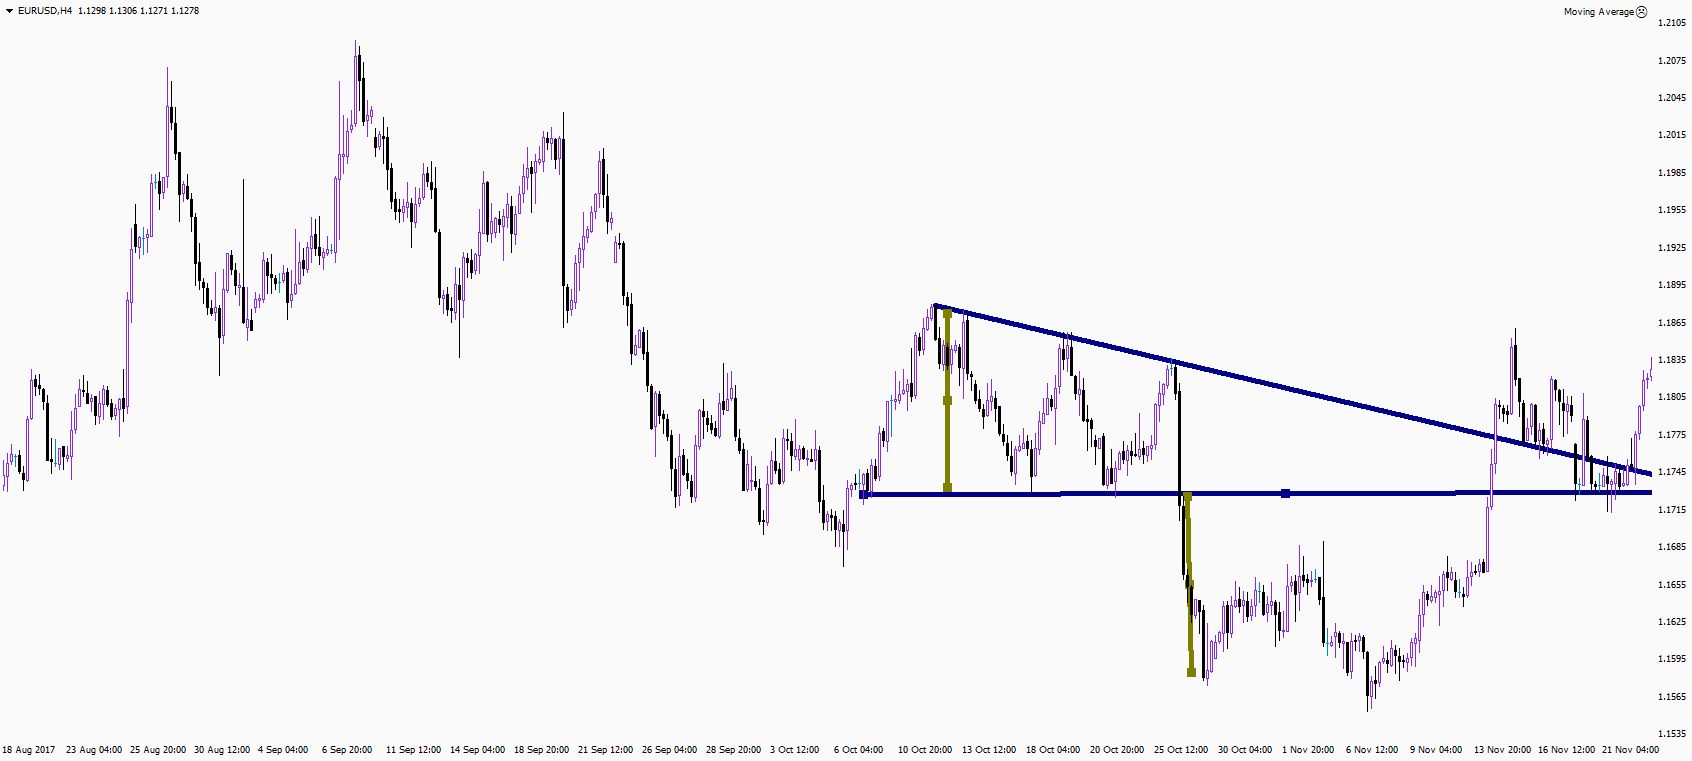
The Ascending and the Descending Triangles
The Ascending Triangle pattern is formed when price makes a series of higher sloping lows and identical highs. And The Descending Triangle pattern is formed when price makes a series of higher sloping highs and identical lows. If you connect high and lows with 2 lines a triangle would be formed. The Ascending and the Descending triangles are trend continuation patterns.