
Excerpt: Are you new to trading? Then it is crucial to understand the basics of analysis. Forex4you has created a simple Forex technical analysis course for you to begin with.
Technical analysis today is the most popular and common method of analyzing the stock and Forex market. It is used by millions of traders and investors around the world to forecast the prices of stocks, currencies, futures, options and etc. Every day new indicators, techniques, and theories appear on the use of technical analysis. Some of them become real breakthroughs and go down in history, while others are modernized versions of previously introduced discoveries. In today's forex technical analysis course, we will discuss the main principles of Forex technical analysis and why it is so popular for trading Forex.
What is Forex technical analysis?
In technical analysis, a variety of tools and methods are used, but all of them are based on one general assumption: by analyzing time lapses and identifying trends, it is possible to predict the behavior of prices in the future. It is based on the analysis of time series of prices, most often graphs with different time frames.
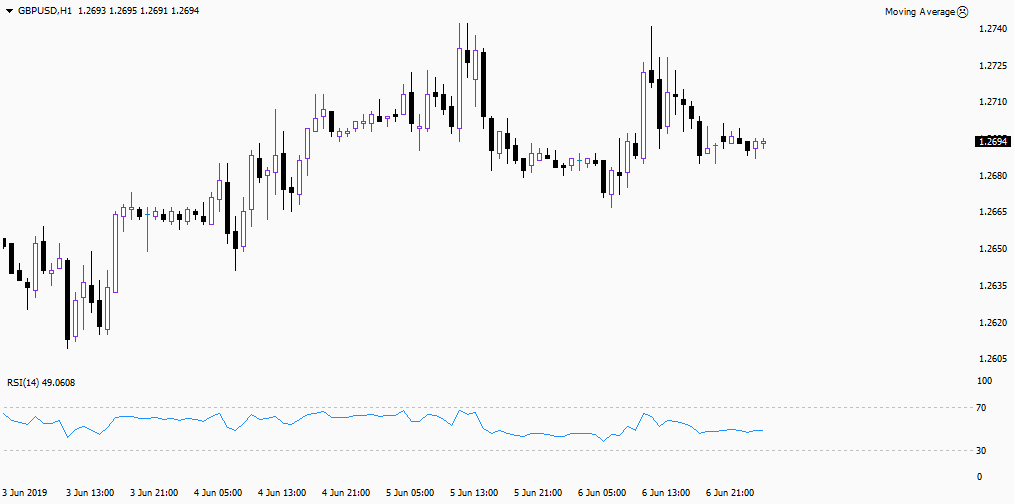
The most popular charts used by Forex traders are candlestick charts. Above is an example of a trading chart where the British Pound is trading against the US dollar. This chart was taken from the trading software MetaTrader4, which is the most used trading softwarre for Forex traders in the market. For more information about Metatrader 4, please check our article about the 'Most popular Forex technical analysis software’ (Add hyperlink to the Forex4you article).
The history of Forex technical analysis and basics
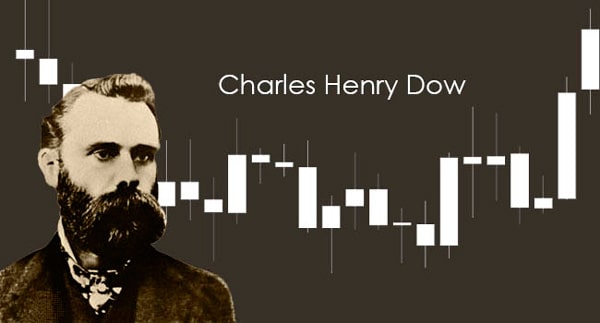
The founder of modern technical analysis is the analyst Charles Dow, who at the beginning of the 20th century formulated the basic principles and postulates of the technical analysis. The principals and tenets have remained relevant until now.
1. The market price takes into account everything
-
This means that any event that occurred in the economy, in politics and that is relevant to the market, is already taken into account and will be reflected in the stock price.
2. Price movement is directional and price moves in trends
-
This postulate underlies the whole technical analysis: the price movement is not chaotic fluctuations but has an upward or downward trend. Various technical analysis tools serve to determine the direction of this trend.
-
Prices of securities tend to move in observable trends with a tendency to stay in the trend
-
The trend is considered to be intact until the trend line is broken
-
After a trend has been established, the future price movement is more likely to go in the same direction as the trend rather than against it
-
Trade in the same direction as the trend
3. History in the market repeats itself
-
This axiom is based on the properties of human psychology and says: if in the past, under some initial circumstances, history developed in a certain way, then in the future, under the same circumstances, it will develop in the same way.
-
Many of the chart patterns in the technical analysis are still believed to be relevant, even if they have been used for 100 years because they illustrate patterns in price movements that often repeat themselves
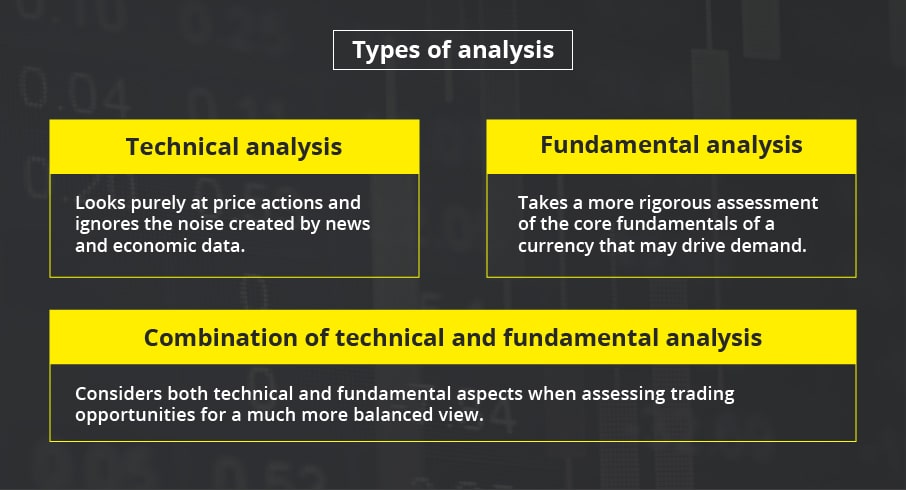
Technical analysis vs Fundamental analysis: What the difference?
Technical analysis helps to predict the likely direction of the price movement of an asset based on the identified patterns in the dynamics of its price in the past. Technical analysis is only interested in price movements in the market, but not on the "value" of a company. A trader uses technical analysis to determine the best conditions for opening a position in the market, that is, buying and selling stocks. Fundamental analysis involves analyzing the characteristics of a company to estimate its value. It is used to study the financial and economic state of industries, individual companies, and investment attractiveness. Companies are attractive if their shares are stable in the long term, and the companies themselves have the potential for development. Market analysts, who prefer using fundamental analysis, in other words, fundamentalists track economic reports and annual reports. Fundamental analysis allows understanding whether the shares of a company are undervalued or overvalued at the moment. Technical analysis allows determining the best time to enter into transactions. Fundamental analysis is more used for long-term investments, while technical is used for short-term speculative transactions in the market.
Forex technical analysis tools
In technical analysis, the following additional tools are used:
-
indicators - a certain averaging of the price parameter, on the basis of which we can assume the trend of price movement in the future. The goal of using indicators is to identify trading opportunities.
-
oscillators, which are used, as a rule, when the price moves within a relatively narrow “market corridor”. This tool is typically used in conjunction with other technical analysis indicators to make trading decisions, especially when find a clear trend in a company's stock price gets harder.
The most well-known and frequently used indicators and oscillators are RSI, MACD, Momentum, Stochastics, ADX.
Why forex technical analysis is so popular?
If you look at the statistics, you can see that 90% of traders are starting to get acquainted with the stock exchange on the basis of technical analysis. In practice the professional trader usually uses a combination of fundamental and technical analysis. Both methods complement each other well, and their simultaneous application helps to get a complete picture and understanding of the overall market picture and most accurately calculate the future direction of price movement.