Excerpt: Why are most Forex traders using candlestick charts? Learn the basics of a candlestick chart, but also the pros and cons of using these charts for technical analysis.
Did you know that the majority of traders use candlestick charts to analyze and trade Forex? Some of the reasons behind this choice, is because candlestick charts are easier to read price action; they show in a quick glance more in-depth information in a simple and clear manner. Furthermore, Forex traders look out for the different types of candlestick patterns, which immediately tells what a trader can expect next based on historical price movements. Yet, what are the essential things you should know about candlestick charts? In this article, we will guide you briefly through the history of candlestick charts, show you how to read a basic candlestick, but also discuss a few pros and cons of using candlestick charts for technical analysis.
History of Candlestick charts
Candlestick charts were invented in the 18th century and it gained popularity in Asia after the rice merchant Munehisa Homma utilized the candlestick charts to trade rice on the Ojima market, in Osaka Japan. The merchant used a model that resembles to today’s candlestick patterns. It wasn’t until the 90s that the candlestick charts became popular in the US and Europe. Prior to this period, the financial markets in these continents mainly used line or bar charts. It was Steve Nison, a chartered market technician, who introduced in the early 90s the candlestick charts to the western financial markets. The traders in the US and Europe realized that it was much easier to read and understand price action with candlestick charts rather than the bar or line charts. Also, these charts showed the price action in a more visual and accurate manner with colours to distinguish the direction of a currency price. Due to these features, the use of candlestick charts became the norm in the financial markets in the last few decades.
The structure of a candlestick and chart
It is important to understand the basic structure of a candlestick, before you start reading a candlestick chart. Similar like a bar in a bar chart, a candlestick also represents a specific time period: 1 minutes, 1 hour, 1 day, 1 week, 1 month or another time period. Unlike a bar, a candlestick informs trader much more values:
-
Firstly, it shows the opening price at the beginning of a time period, which the candlestick represents
-
Secondly, the candlestick shows the closing price at the end of the time period
-
Thirdly, the candlestick shows a trader the highest price that was recorded during the time period of the particular candlestick
-
Fourthly, the candlestick shows the lowest price during the time period
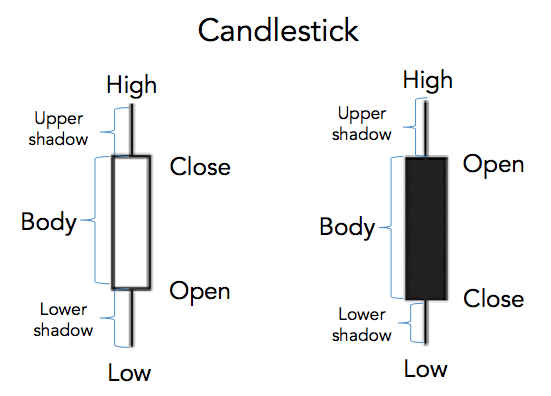
Above you can see that a candlestick can show a trader if a trading period ended bullish or bearish, depending on the closing and opening prices. When the closing price is lower than the opening price, it’s a bearish candle. On the contrary, when the closing price is higher than the opening price, it’s a bullish candlestick. The upper and lower whisks you see, which are also called upper or lower shadow, show the lowest or highest price that was recorded during the time period, which the candlestick represents. A candlestick chart is quite similar to a bar chart, since it also shows the main price levels for a given time period. As explained in the previous paragraph, unlike a simple bar, the candlesticks have a lot of qualities and are colored to display which direction the currency pair is heading. This makes it easier for a Forex trader to understand the price movement of the currency pair, which results into more informed trading decisions.
Pros of using Candlestick charts for Technical Analysis
#1 Superior to Traditional Charts
Traditional bar charts have very less meaning by themselves, whereas candlestick charts show the price action that took place in the market in detail. Looking at the price action in a Forex pair over time allows traders to use pattern analysis to determine the probability of future movement. After a small amount of timely usage, candlestick chart pattern analysis can play an integral role in the day-to-day life of a Forex trader.
#2 A Psychological Viewpoint
Currency trades often are influenced by greed, fear, and hope. Thus, technical analysis needs to be used to understand these psychological factors. Hence, by having candlesticks pattern analysis as an integral part of your technical analysis, it will allow you to read the changes in the market’s determination of value, without the influence of any of the mentioned human weaknesses. This is also known as investor sentiment. Candlestick charts do this by displaying the interaction between buyers and sellers, which often reflects in price movement.
#3 Easy to Understand
Candlesticks patterns visually provide a clear and easy set of patterns that are highly accurate. By using candlesticks charts, mixing with some basic technical analysis, you can easily spot to see patterns that emerge in the market. Also, you can start taking profits by these patterns when you trade.
The best thing about candlestick charts is that they don’t take time to master. With daily practice, the patterns can be memorized easily, and though it does take little effort, the profit potential after understanding these charts is invaluable. Also, there are a great number of technical indicators that will signal you when a candlestick pattern emerge.
Cons of using Candlestick charts for Technical Analysis
#1 A candlestick can look different on every time-frame
A candlestick pattern might seem perfectly formed on one timeframe but it can also appear completely opposite on another. This makes it difficult to trust the message of a candlestick pattern a 100 percent, if you use multiple timeframes. Therefore it can cause doubt for traders to decide and execute their trades. If the candlestick is of sufficient size, it might appear on multiple timeframes, but this is an uncommon occurrence.
#2 Unpredictability and difficulty in managing risk
Trading with candlestick charts can cause an impact on risk management. Most Forex traders enter on the close of a candle and place their stop loss at the candlestick low. The problem arises from the fact that you won’t know where the candle will close. Thus, it makes pre-planning a tricky trade and impacts a trader’s risk management.
#3 Lagging indicator
Technical analysis candlestick pattern is a lagging indicator because most of the Forex traders wait until the close of a candle before entering a trade. This has many drawbacks, with the most important being that lagging indicators only record the results, so it leaves room for the trader to decide or speculate on the next price movements.