Excerpt: For most of the novice traders it becomes difficult to determine the trend of the currency pair. Learn the concept behind technical analysis using multiple timeframes with Forex4you’s tutorial.
Technical analysis using multiple time frames is a trend trading strategy in which the forex trader combines a short-term, medium-term and long-term timeframes to analyse and trade along the direction of the trend. In simple words, the trader uses multiple timeframes to spot zones where the short-term and medium-term timeframes align with the trend on the long-term timeframe charts. Moreover, the timeframes start from 1 minute timeframe and traders can visualize it upto monthly time frame. In between you should also consider M5, M15, M30, H1, H4, daily and weekly timeframes. The essence of multiple timeframe technical analysis is to set up a trade on the lower timeframe together with the long-term trend of the forex pair. This strategy will ensure you to not go against the trend when setting up a forex trade.
Multiple timeframes technical analysis
The long-term positions on the daily, weekly and monthly timeframes are typically used by long-term traders. Some of these positions are held for years. So, if you have to trade a short-term position such as going long on a forex pair with a trade time of 30 minutes max, then you need to be sure that the trend is in upward direction. Multiple timeframes technical analysis does not place excessive focus on one timeframe. You will use the long-term timeframe to determine the trend of the forex pair, but the single candle which forms the price information for a day’s worth of trading on a D1 chart will not tell you where to set the trade. This might probably not tell you what technical entry will mirror the trend. This is where the short-term timeframes should be used. This can help you whether there is a possibility to enter a profitable trade in the direction shown in the long-term charts. For you to completely understand how multiple timeframe technical analysis works, we’ll illustrate you with a simple example.
Step 1
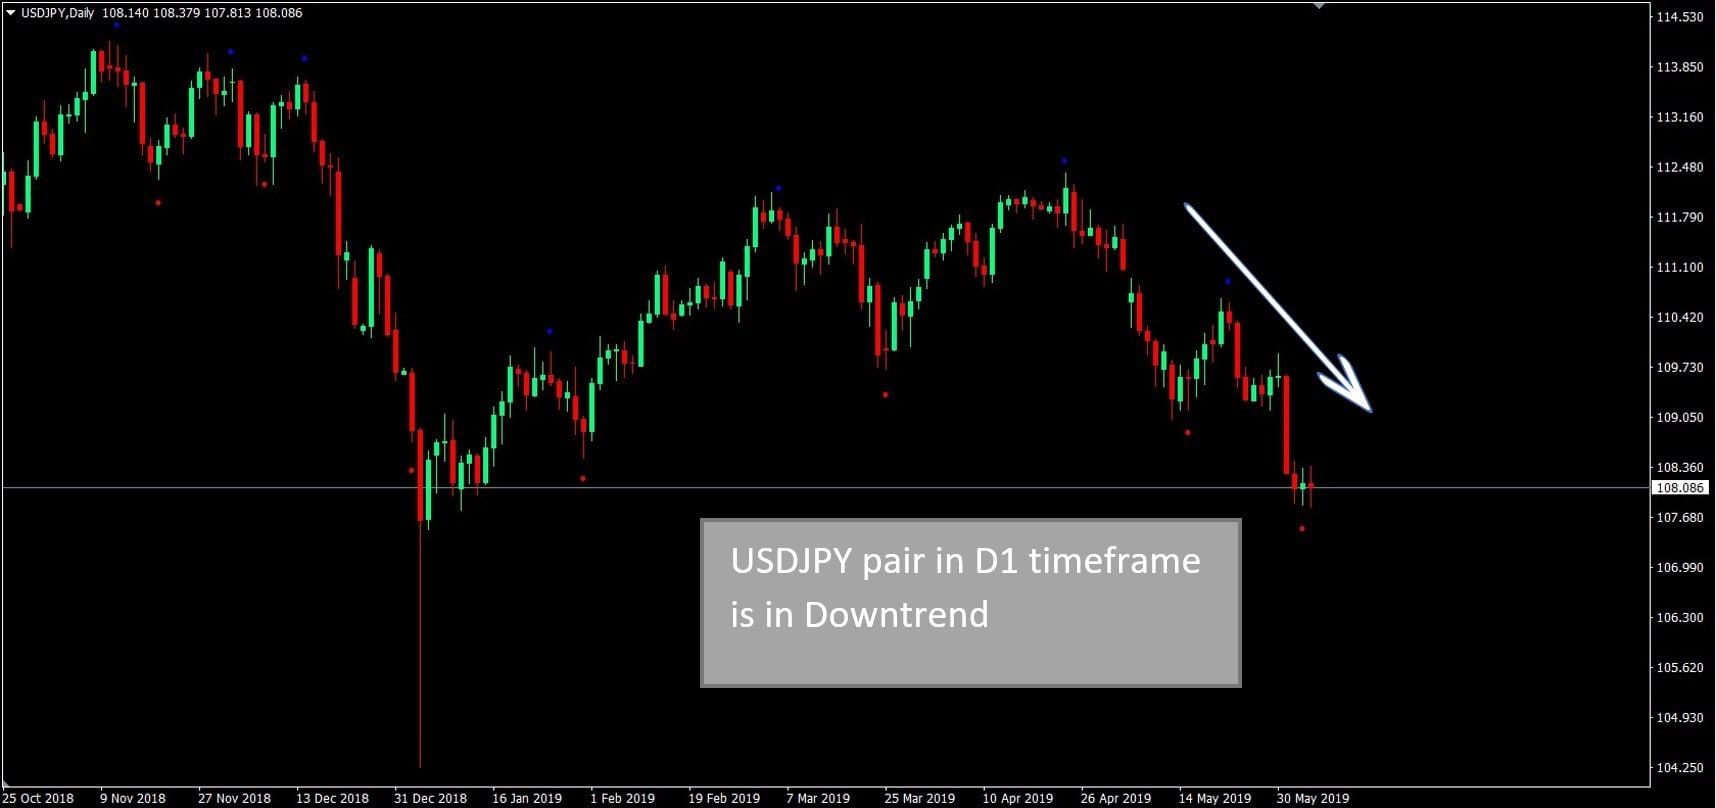
Pick any forex pair to trade and open the Daily (D1) chart. From the D1 chart, USDJPY is in a downtrend. Therefore, the goal here is to initiate a short trade. All we see on that day is a very thin doji, which is not enough to make any trade decision.

Step 2
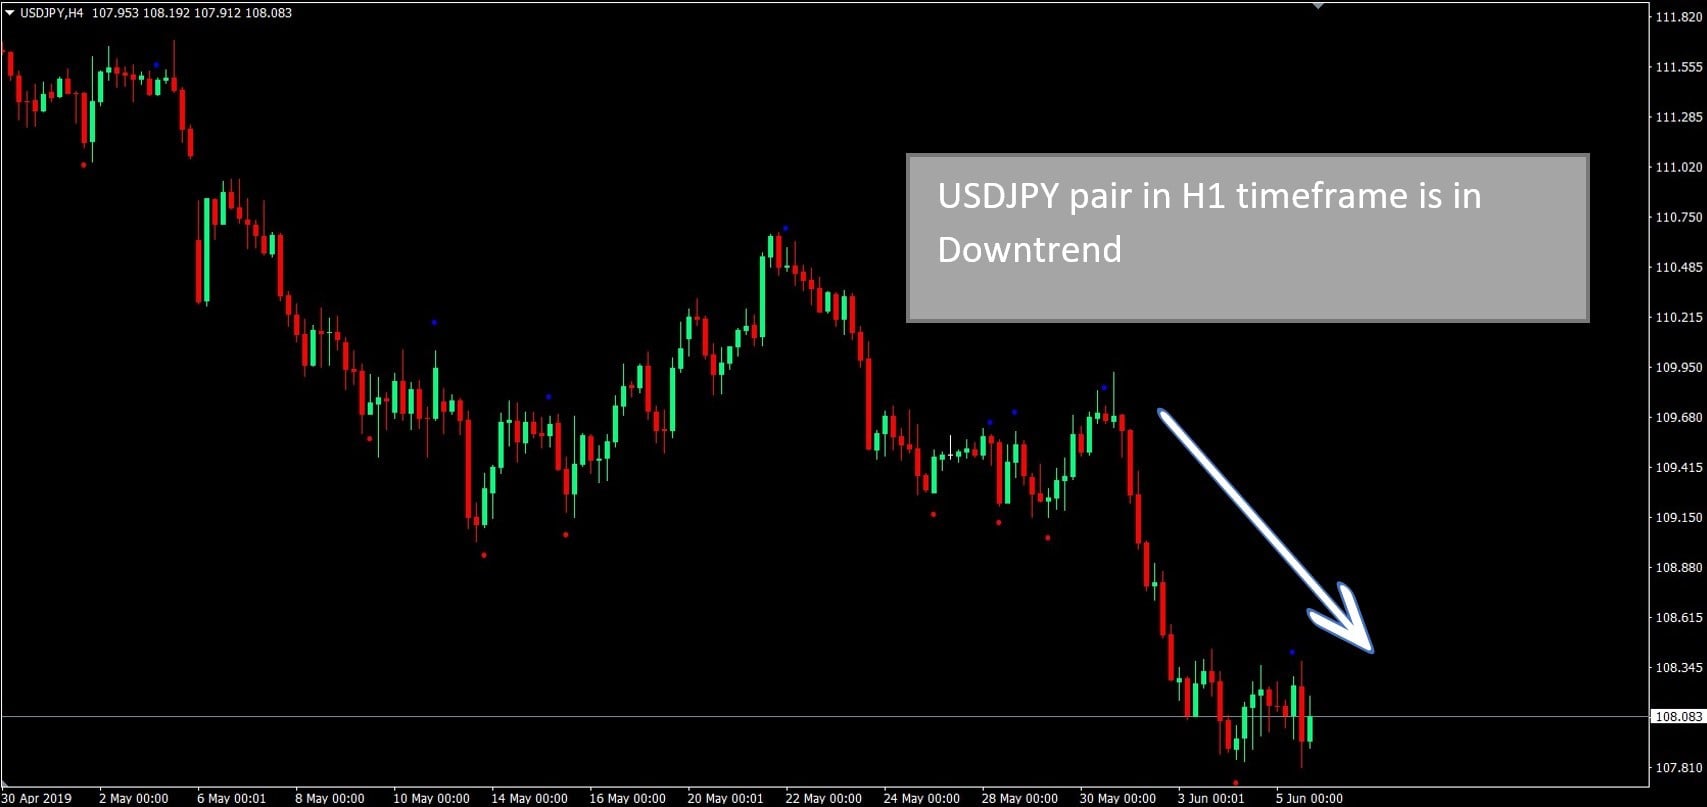
Now, we’ll move down into more granular level to the 4-hourly chart to get a broader view of what is happening on the daily chart. The H4 chart shows that the forex pair is in a downtrend trend. This confirms that the market is behaving according to the order of the trend seen on the daily (D1) chart.

Thus, at this point also there is still not enough information to make an entry decisions. So, you have to add the Hourly (H1) chart to check if some more information can be obtained to enter the trade.
Step 3
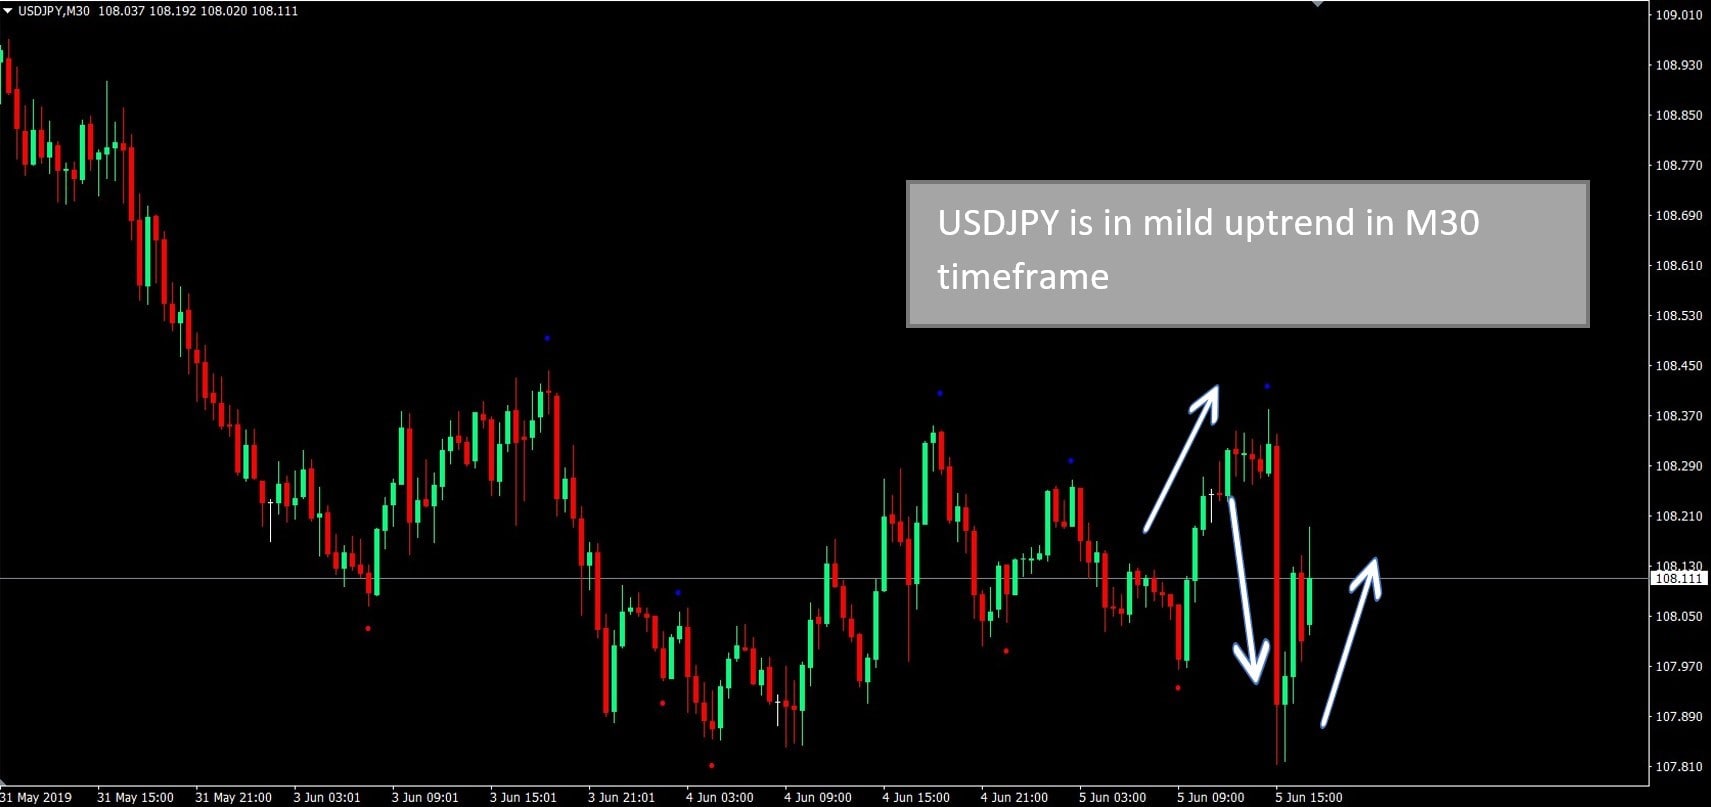
Lastly, the M30 chart is loaded which shows the chart in more details. Here you can see that the price action started the day with a mild upside move resulting in the formation of several doji and pinbar candles.

The last of the pinbars closed below the resistance level, so a short trade would be the best option.


