Forex Trading with The Stochastic
Stochastic is one of the most popular oscillators in the world, which helps traders to understand when price changes direction. It is used in Forex, stocks and crypto trading. The Stochastic indicator allows us to reveal several key things:
-
Excessively low or high price level;
-
Divergence;
-
Signals of trend reversal.
The stochastic oscillator consists of two lines, which are displayed on a scale from 0 to 100.
-
The first line, also known as % K, displays current closing price in relation to the price range you have selected.
-
The second line, also known as % D, is a simple moving average (SMA), calculated on the basis of % K line.
Parameters of the indicator can be changed according to your personal preferences.
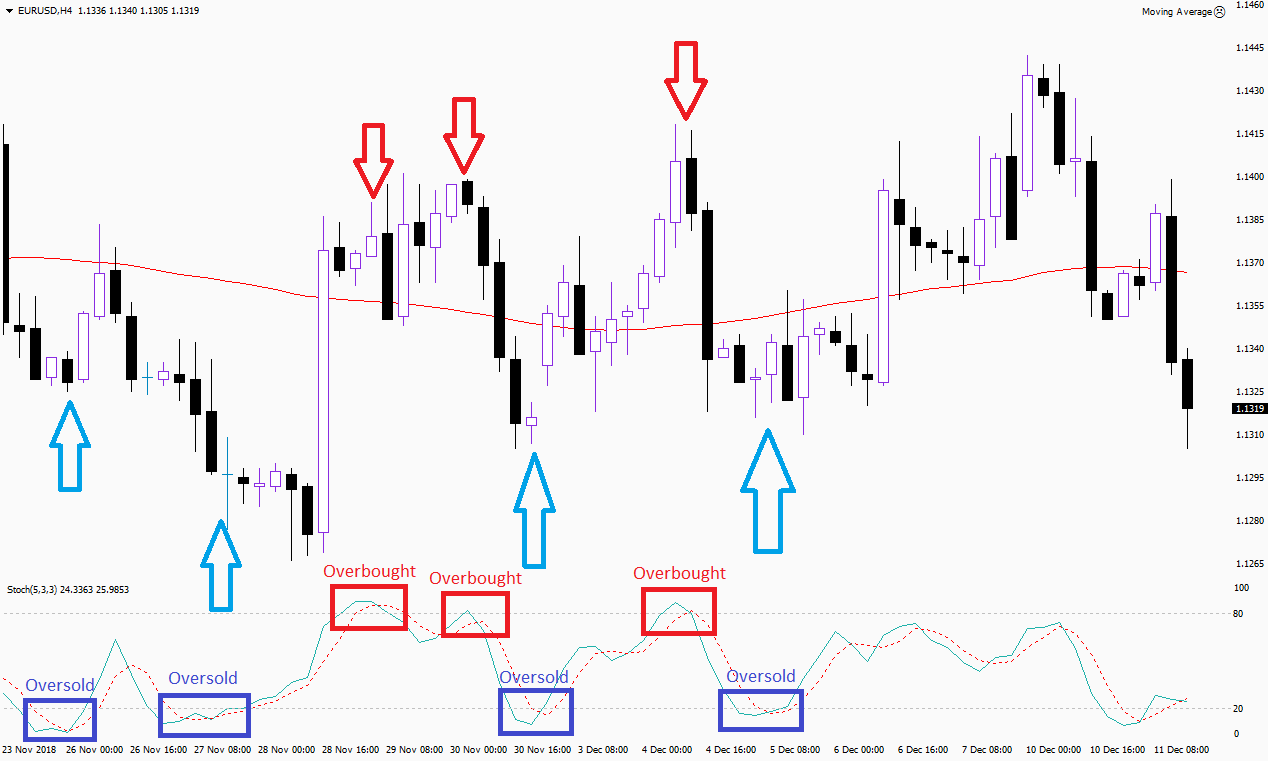
The main signal that Stochastic generates is overbought or oversold.
-
Anything above 70 is overbought.
-
Anything below 30 is oversold.
The best signal, which Stochastic generates, is when its lines go beyond the overbought or oversold zone at the stage of rising or falling prices.
What Is Divergence?
Divergence is a situation when price and indicator are going in other directions. When price goes one way (is rising), but indicator goes another way (is falling), a trader gets a signal that the price (bullish) direction can change soon (fall).
Trading Forex with the RSI
The Relative Strength Index (RSI) is one of the key oscillators used throughout the world.
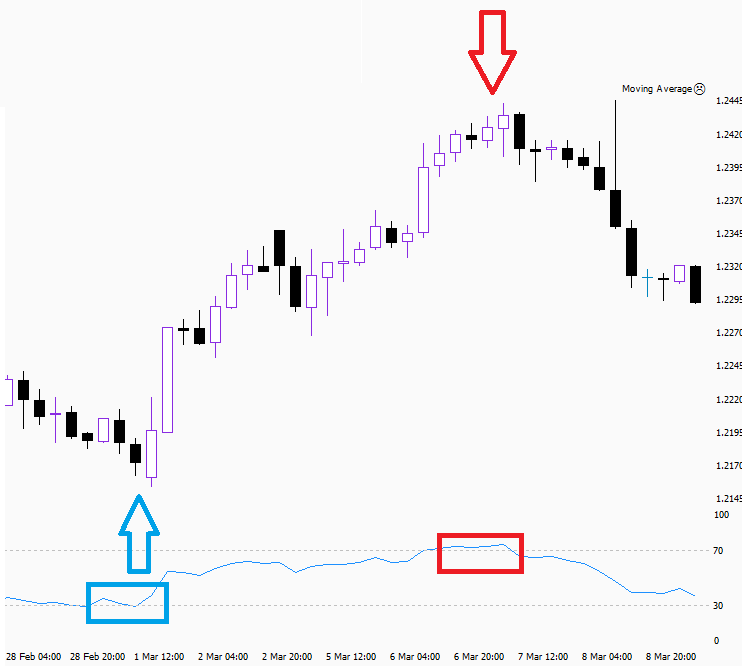
With the help of RSI, traders can analyze the strength or weakness of the current market price condition. The indicator is based on the use of closing prices for a certain period of time. The RSI is displayed on a scale ranging from 0 to 100:
-
The closer RSI is to 0, the less active bearish trend becomes (trader considers to buy).
-
The closer RSI is to 100, less active bullish trend becomes (trader considers to sell).
By default, the indicator parameter is 14 days. This value can be changed in the indicator’s settings.
Using the Forex Indicator MACD
The Moving average convergence/divergence (MACD) is also one of the popular oscillators around the world. The indicator was created by Gerald Appel in 1979. The main idea behind the MACD is to show trend strength, direction, momentum and duration. The MACD consists of three simple components:
-
MACD line;
-
Signal line;
-
Bar chart.
The MACD generates signals in three situations:
-
Crossing the signal line;
-
Crossing the zero line;
-
Divergence.
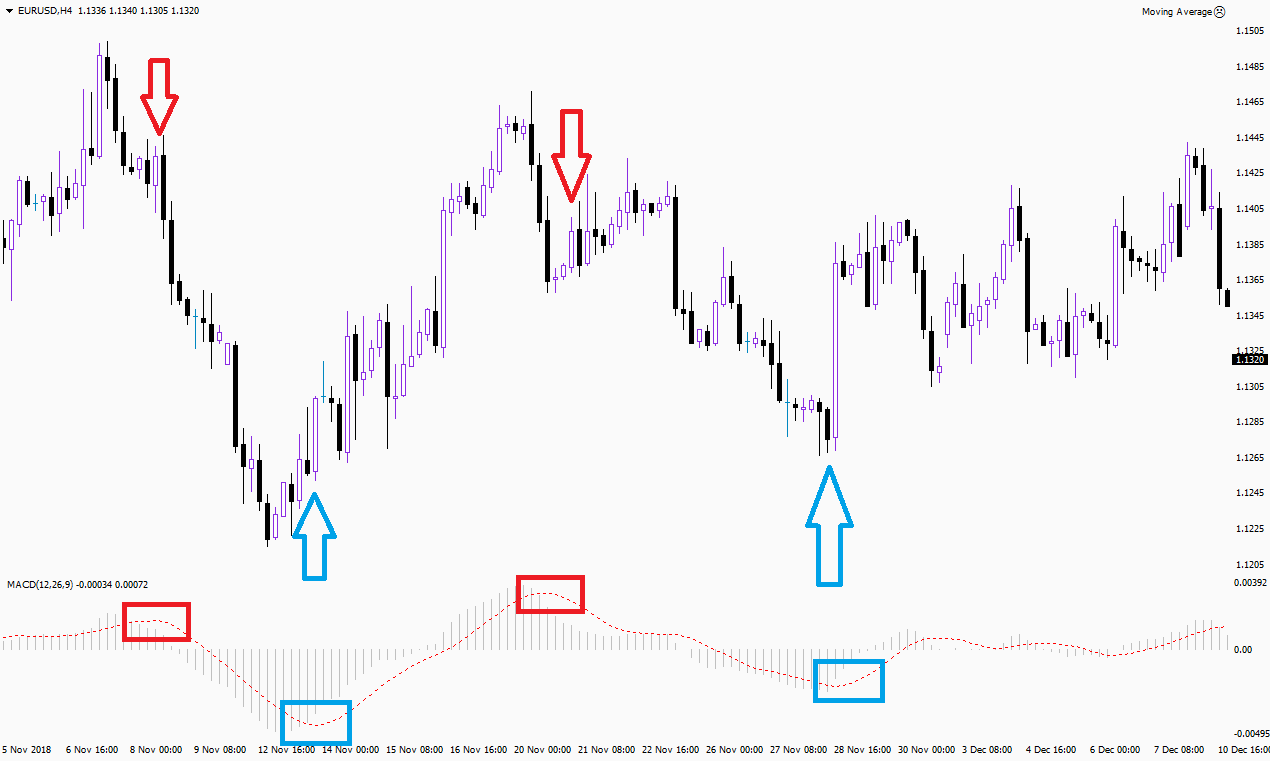
Crossing the signal line.
If the MACD line crosses the signal line, a trader can expect a sharp price reversal. If the MACD line crosses the signal line from bottom to top, the price is expected to go up. If the MACD line crosses the signal line from top to bottom, the price is expected to go down.
Crossing the zero line.
If the MACD crosses the zero line from bottom to top, the price is expected to go up. If the MACD crosses the zero line from top to bottom, the price is expected to go down.
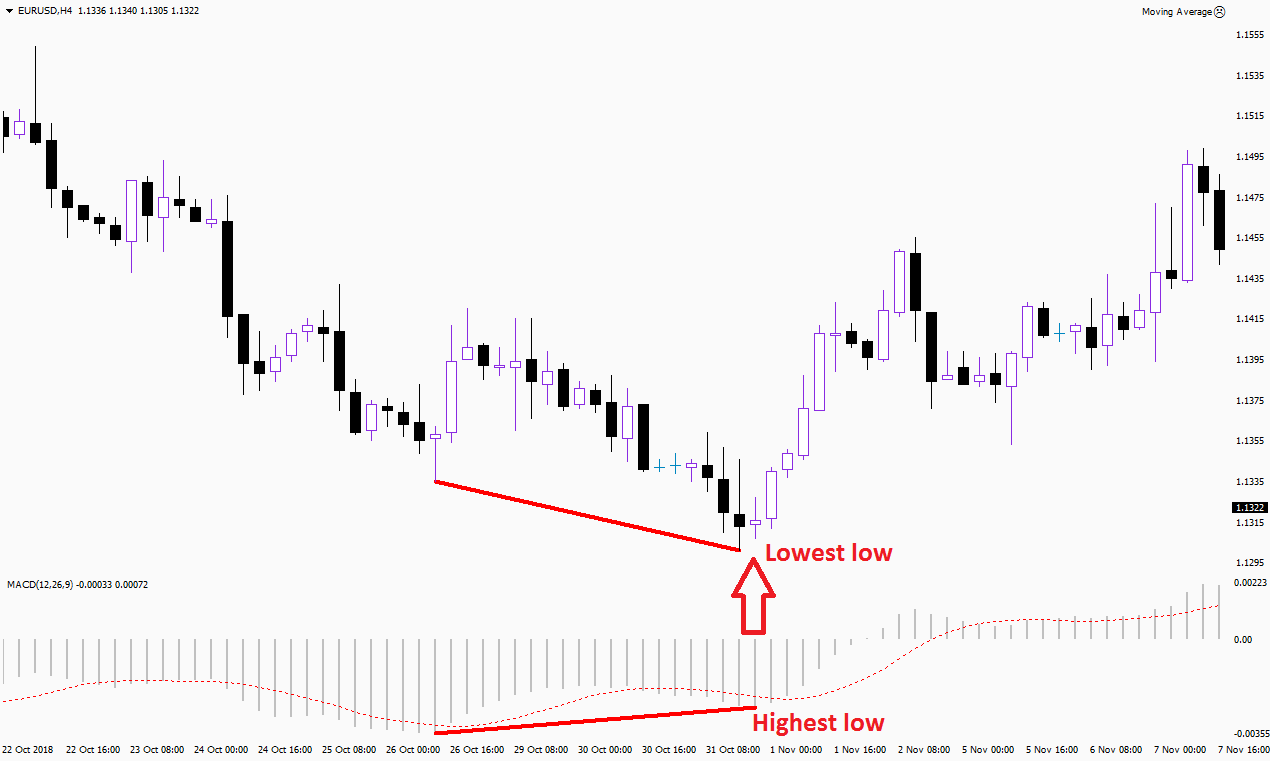
Divergence.
The MACD divergence works exactly the same as with the Stochastic. If the MACD goes up, but the price goes down, then a trader can expect the price to grow in the nearest future. And vice versa: if the MACD goes down, but the price goes up, then a trader can expect the price to fall in the nearest future.