Excerpt: Have you always wondered how to use the Relative Strength Index (RSI)? With Forex4you’s beginners guide on RSI, you will learn how to use RSI in various ways.
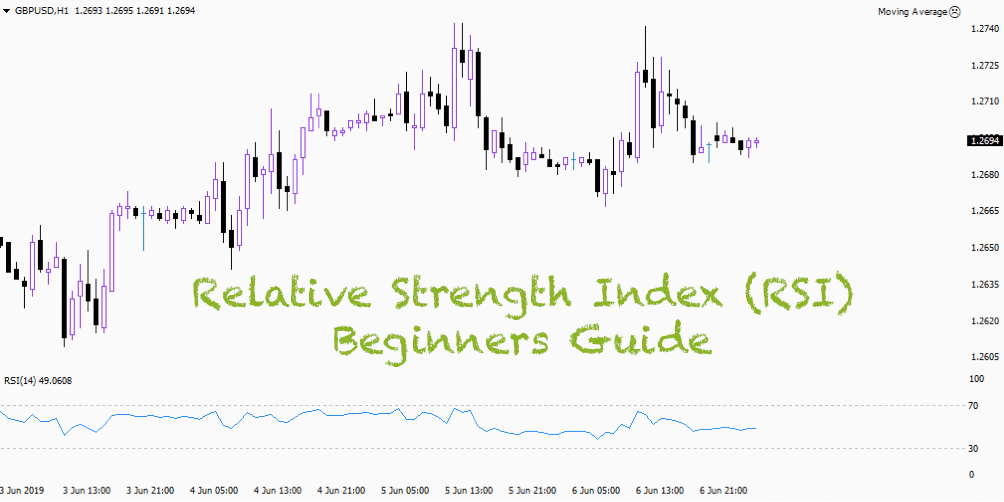
Relative Strength Index (RSI) is one of the most popular technical indicators among Forex traders. RSI is displayed as an oscillator and can be found in the standard set of major trading terminals, including that of Forex4you. RSI has one line, which helps to determine strength of trading instrument (security) current trend, as well as possible points of its reversal. RSI compares the absolute value of a trading pair price growth over a certain period of time with the level of its fall over the same period. The result of such calculations is displayed as a curve on a chart with a range of values from 0 to 100%.
How to read and use RSI parameters?
RSI indicator has a single parameter, which is the number of periods that the indicator looks back on. The default period is 14. The value of the period can be changed depending on the activity of foreign exchange market. Traders should keep in mind that during volatile market, when the indicator curve crosses levels of 30 and 70%, most of the time it is generating false signals. To eliminate false signals the RSI period can be increased, for example, to 21. Traders should use shorter period when there is low volatility in the market, so the indicator signals appear rarely. In such situations, traders can reduce RSI period to 7. The main trading signal of RSI indicator is divergence (discrepancy in trading pair price behavior and the indicator readings). If price makes two rising highs and RSI indicator draws two lowering highs at the same time, this indicates a weakening of bullish trend, which can lead either to a reversal of the current trend or a potential corrective movement in the opposite direction. The converse is true for a bearish trend.
How to use Relative Strength Index (RSI)?
Welles Wilder, RSI creator, considered the fact that sooner or later price changes its direction, because a trading pair price can enter overbought or oversold zones. For this reason, the most significant for RSI indicator are its 30 and 70 levels. If RSI values stay between 70 and 100 for a long time, then the trading pair price is considered to be overbought. Therefore, a reversal is quite likely. RSI level 70 and higher is considered to be an overbought zone. Accordingly, any RSI value from 0 to 30 is considered to be oversold zone, meaning that price is too low and can turn upwards. Traders should consider entering a market, when RSI leaves oversold or overbought zones.
Other Ways to use RSI
Graphic shapes analysis on RSI chart
Quite often graphic shapes (triangles, pennants, “head and shoulders”, etc.) are formed on the RSI indicator chart, while on the price chart they could not be found. Interpretation of graphic shapes is similar to their interpretation on price chart.
RSI support and resistance levels analysis.
Support and resistance levels can be detected on RSI chart even easier than on the price chart. Support and resistance levels interpretation is no different from its classical interpretation. Breakthrough or rebound from such levels can give good trading signals. For example, breakdown of RSI indicator support level occurs before breakdown of price chart support level, warning trader about the upcoming trend reversal.
RSI center line (value 50) position analysis.
If RSI chart is above the middle line, bullish mood prevails in the market. If the indicator chart is below the middle line, then bears dominate the market. RSI fluctuates in middle line area, this indicates a flat market. This concludes the major methods of how RSI can be used. If you have questions about the Relative Strength Index (RSI) then post your comment below and we will get back to you. For more education on crypto trading or Forex, visit Forex4you’s website to get all the courses, tutorials, trading tools and more.