Excerpt: Do you use the momentum indicator, MACD for your technical analysis? Here are the basics that you should know, along with the pros and cons of this indicator.
The moving average convergence divergence (MACD) is a momentum indicator that follows the trend. This indicator is made available for traders trading with Forex4you. This indicator is made up of a MACD line and a signal line. The MACD line is derived by the subtraction of a certain EMA period from another. The image below shows a 13,21,8 MACD.
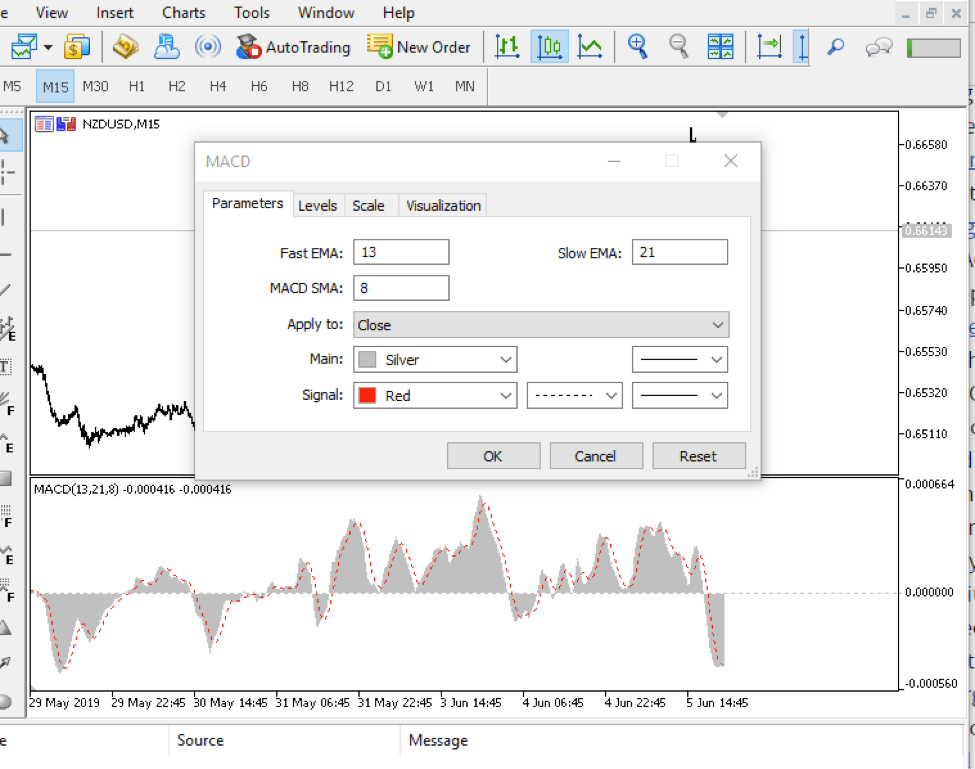
The first is the fast 13 period EMA and then the slow 21 period EMA. The MACD line (shown as the grey histogram) is automatically plotted. It can be calculated by subtracting the slow EMA from the fast EMA. The third MA - 8 period SMA (simple moving average) is plotted across the grey histogram. It is shown by the red dotted line and is usually called the signal line. The basis of the combination is to give a buy and sell signal on any instrument it is plotted and on any time frame. The MACD automatically adjusts to a new time frame. The settings on the terminal can be changed. The default setting on terminal is 12,26,9.
What information does the MACD give?
Indicators are mathematical computations and each often tells a different story. The MACD shows a positive value once the fast EMA is above the slow EMA and a negative value, if the slow EMA is above the fast EMA. The MACD has a baseline of zero on terminal. The farther the MACD is above or below the zero line, the more distant the two EMAs are from each other. This indicates a growing price trend. When the MACD draws close to zero, it shows a weakness in the prevailing trend. Primarily, if the MACD stays above zero, the trend is bullish while below zero indicates a bearish trend. The longer the MACD stays above or below the zero line, the more prevalent the trend.
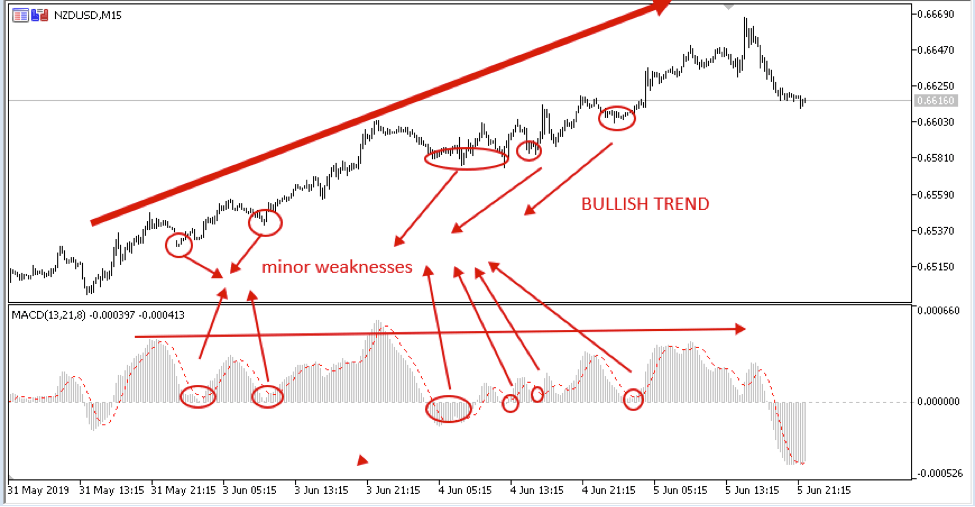
The trend above is bullish on the 15 mins time frame. The MACD stayed above with dips toward the zero line, which showed minor weaknesses. The bullish trend prevailed as MACD quickly returned above the zero line to expand further. The bearish trend will start if the price drops far below the zero line and extends its stay there.
1. MACD crossovers
This is one of the most popular ways of MACD application. In an uptrend (when the signal line and MACD are above the zero line), if the signal line crosses below the MACD histogram, it means the prevailing trend will be weak. However, after the weakness, the signal line crosses above the MACD, it indicates a bullish trend continuation. In a downtrend (when the MACD and the signal line are below the zero line), if the signal line crosses the MACD upwards, it indicates bearish trend weakness. If after the weakness, the signal line crosses the MACD downwards, it indicates bearish trend continuation.
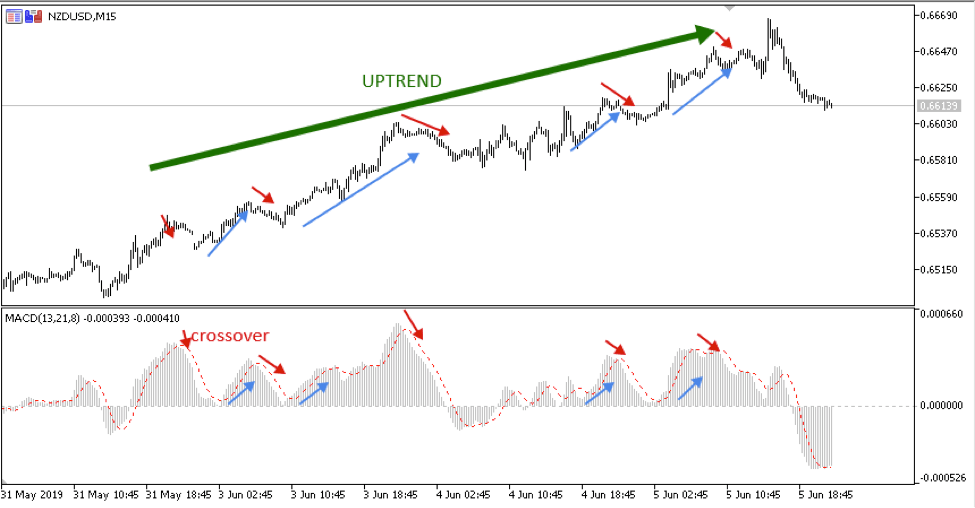
The blue arrows on the price indicate buy signals. Buying into the bullish trend. The same principle applies to the downtrend
2. Price-MACD divergence
When the MACD makes a high and low that diverge from the corresponding highs and lows on the price, this scenario is called a divergence.
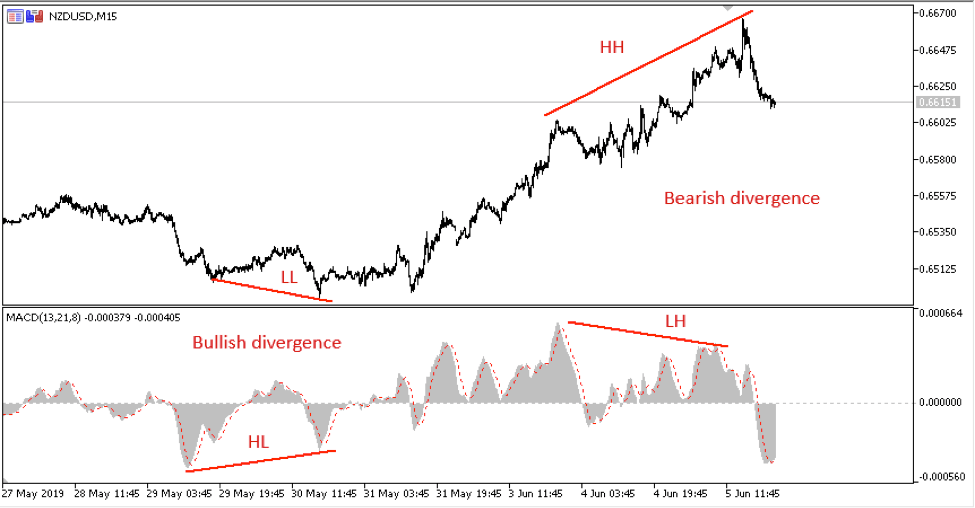
A bearish divergence forms a higher high on the price and a lower high on the MACD. Bearish divergence gives a sell signal. A bullish divergence occurs when the price makes a lower low while the MACD makes a higher low. This indicates a buy signal.
Pros and Cons of using MACD
Pros
-
MACD can be used as a trend indicator and a momentum indicator.
-
MACD provides clear buy and sell signals using the MACD crossover and the divergence explained above
-
MACD can be used in combination with other technical methods for more clarity.
Cons
-
It can provide false reversals. Sometimes reversal signals shown by the MACD divergence does not mean a significant reversal would happen. It could mean that a temporary pause or sideways move is underway before the trend continues. Therefore, MACD cannot forecast all reversals.
-
MACD does not often give an accurate analysis of a trend many times. Trend following signals could also fail or provide insignificant move before a trend reversal.