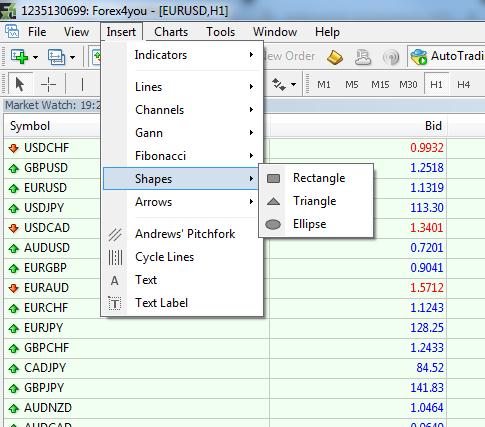
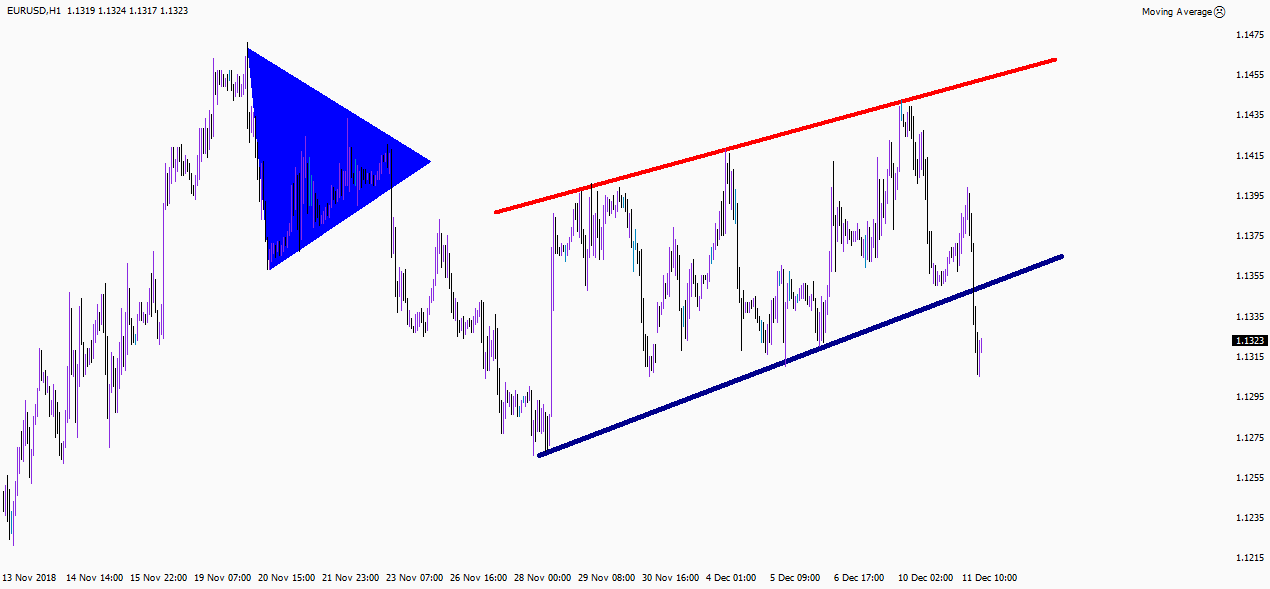
Geometric shapes and Chart Patterns
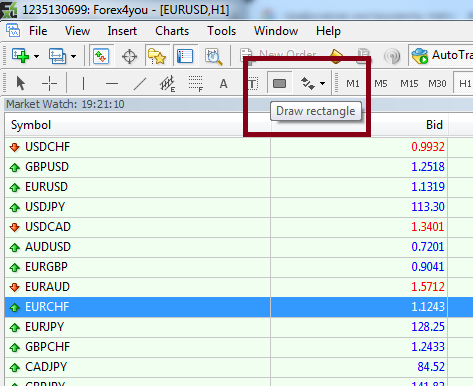
If it’s important to distinguish the difference between chart patterns (triangles) and geometrical shapes (rectangle, triangle and ellipse), which are used only to highlight quotes. To place a geometrical shape on the chart, use the "Insert" tab, then click "Shapes" or select the corresponding button on the toolbar. If the buttons for drawing figures on the toolbar in your terminal are hidden by default, you can display them by right-clicking on the control panel and selecting "Customize" in the context menu.
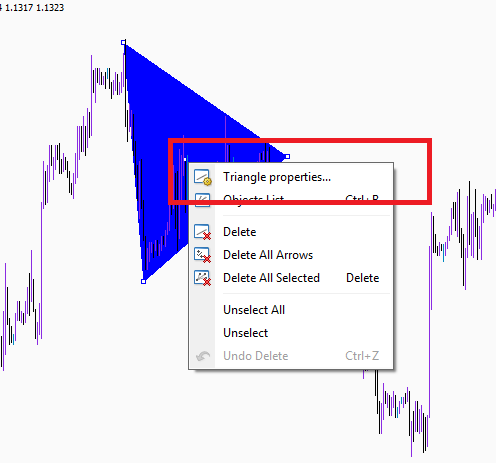
To customize shapes (change size, color, etc.) double-click on it. It will transfer the shape to edit mode, sizing dots will become visible in its center and along the edges. Click on any of them with the right mouse button and select “Properties ...”. In the context menu, which opens, there is a window for setting parameters of the shape. In addition, by capturing the side sizing dots with the left mouse button, you can resize the object. And by capturing the center dot, you can drag the entire shape using the drag-and-drop method. Double-clicking again takes the object out of edit mode.
Draw Lines to Create Support and Resistance Levels
Lines are used by traders to draw support and resistance levels, specific price levels, trends and so on. Double-click a line to select it,, after right-click it to go to parameters of the line.
Another group of graphic objects available to traders in terminal are icons. These are graphic labels that trader can plot on a chart while studying it. In total, the program has eight icons: “thumbs up”, “thumbs down”, “arrow up”, “arrow down”, “stop sign”, “check sign”, “left price label”, “right price label”. You can put them on the chart using the "Insert" menu - "Arrows" button, or by clicking on the "Arrows" button on the toolbar and selecting the desired icon in the drop-down menu
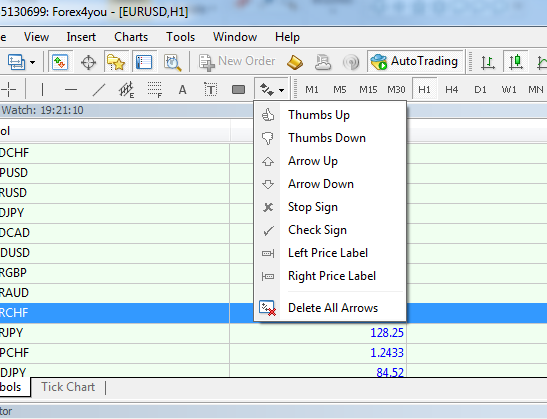
Icons can be adjusted according to the same principle as other graphic objects: double-click takes the icon to edit mode, then using the right mouse button you can access its settings window and change its color, size and other parameters. After you’d applied necessary changes, do not forget to double click, which will take the object out of edit mode.
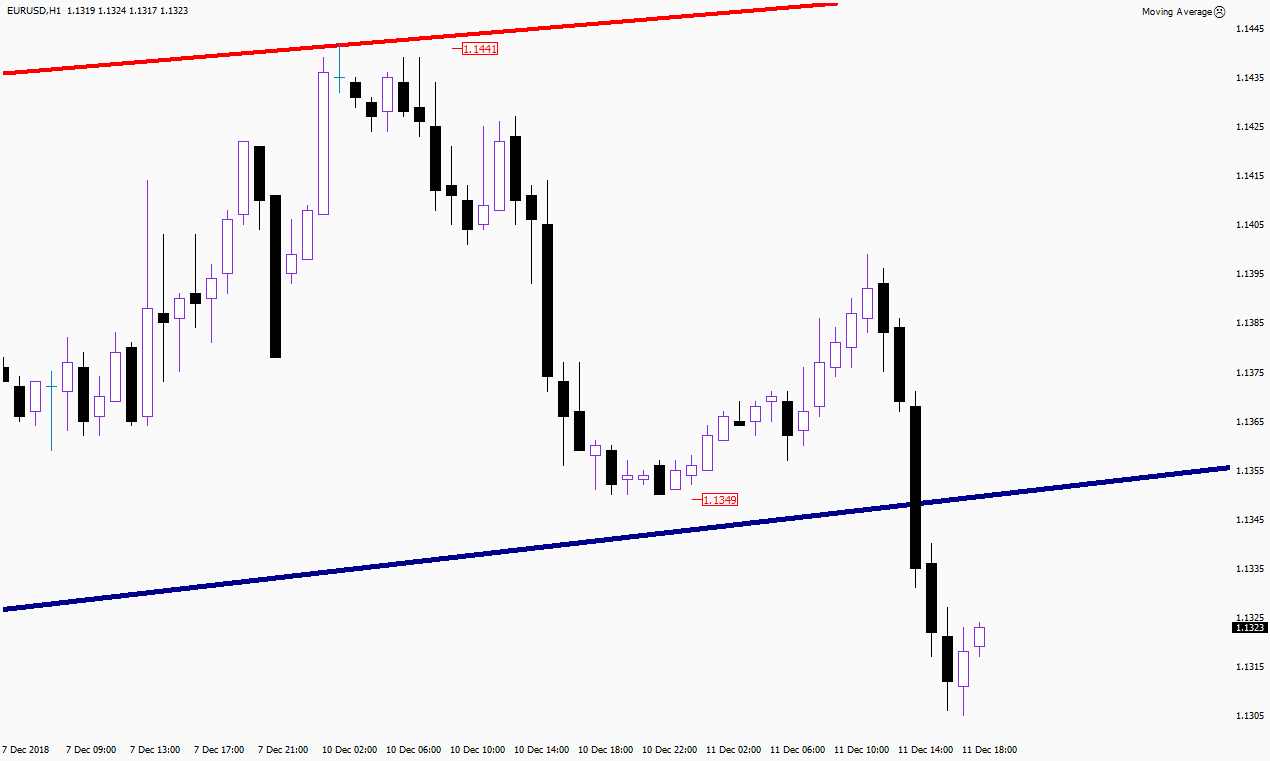
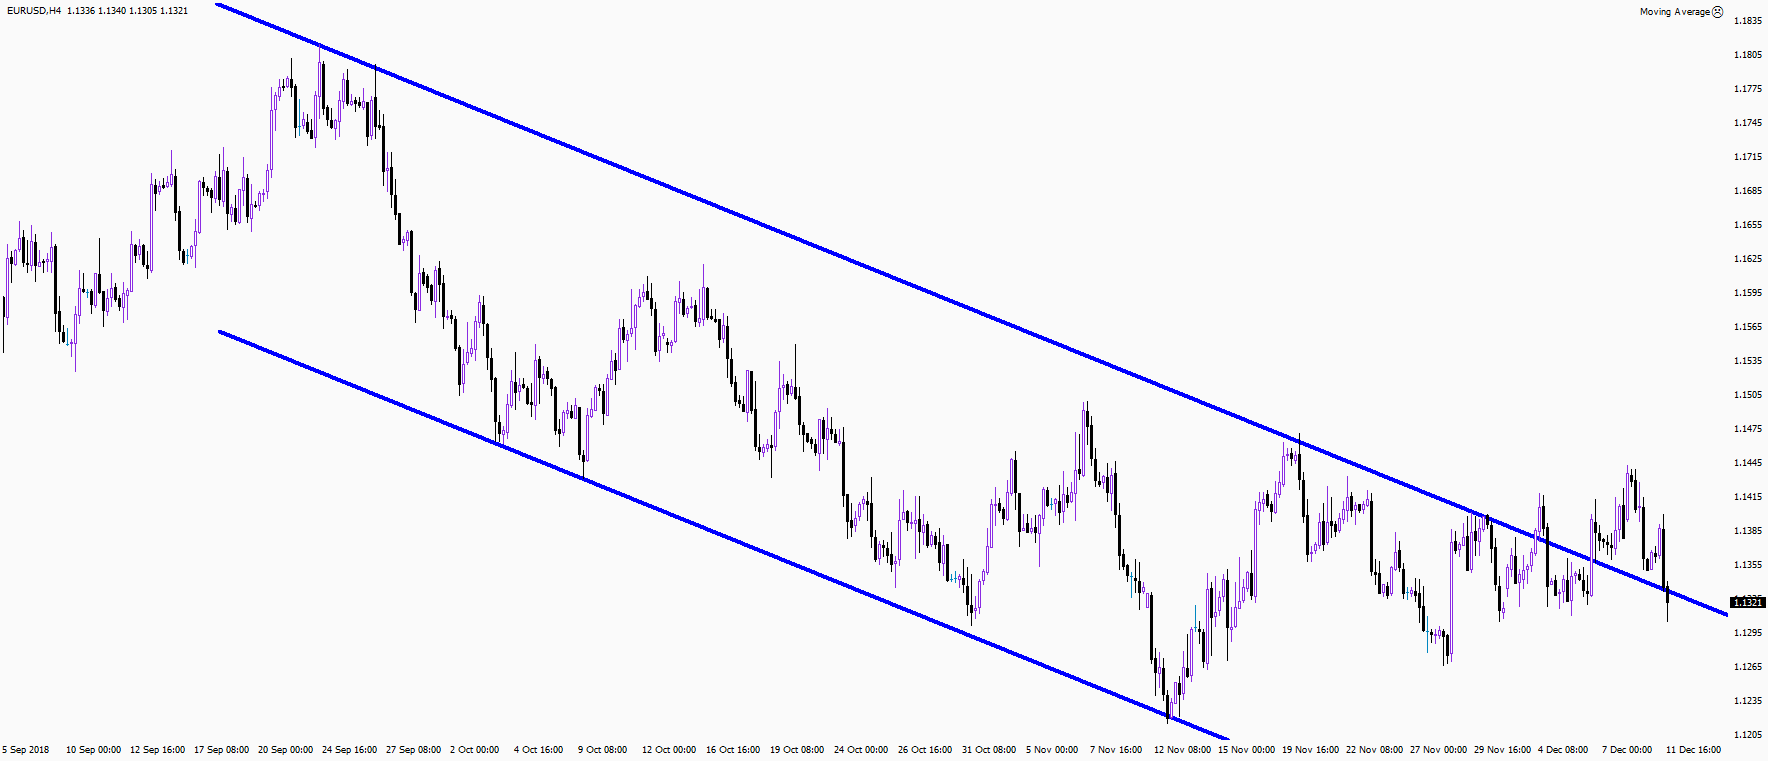
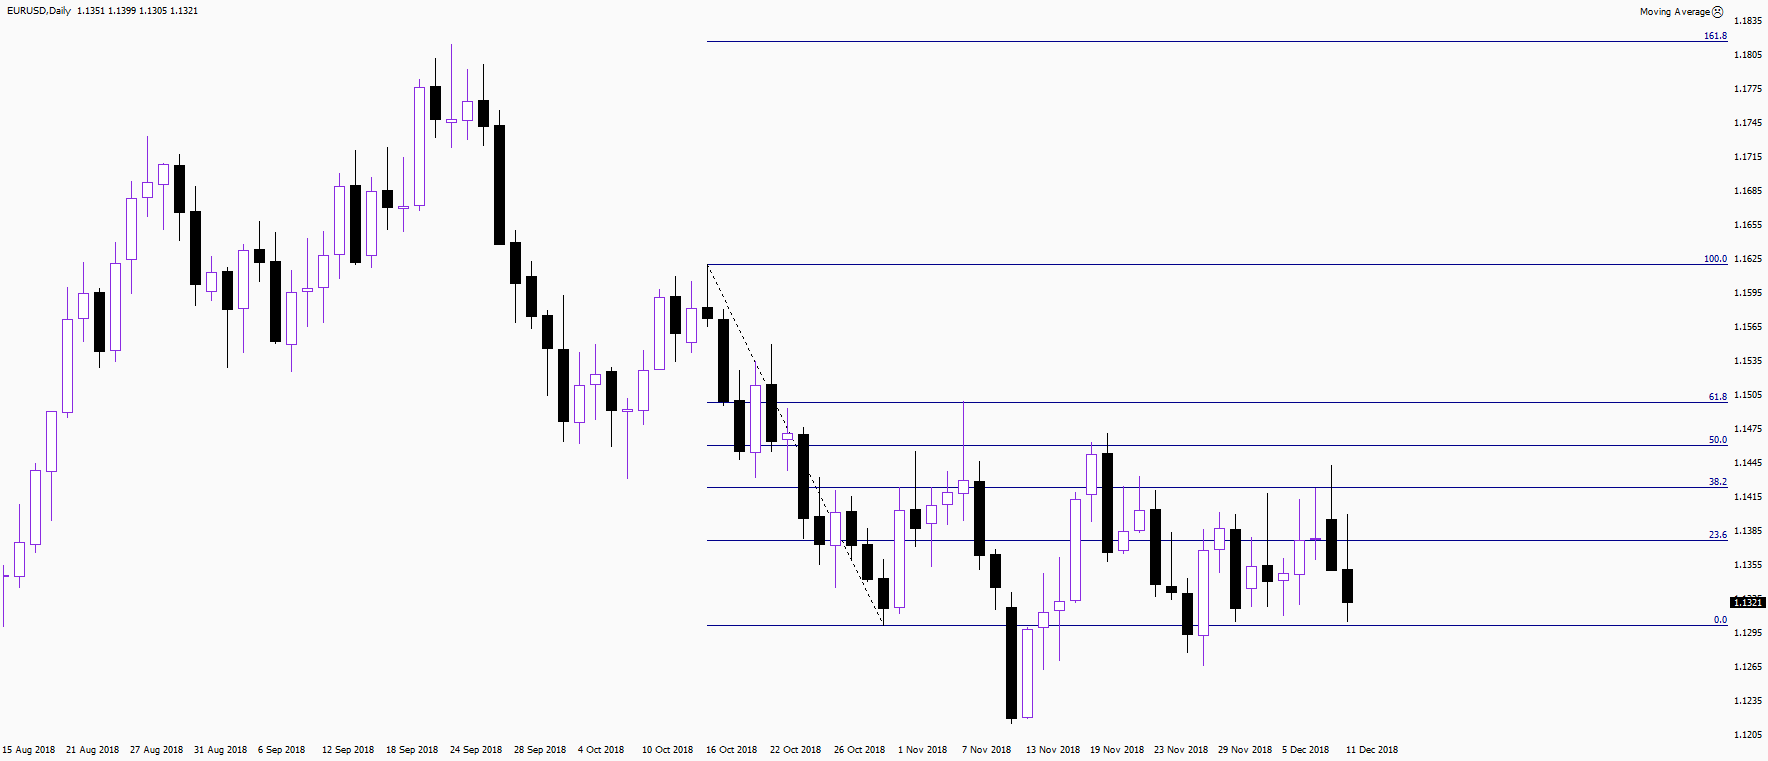
Draw Equidistant Channel and Fibonacci lines
Equidistant Channels and Fibonacci lines can also be applied to a chart to help traders forecast future price movements. The principles of drawing those channels and lines are the same as with usual lines.
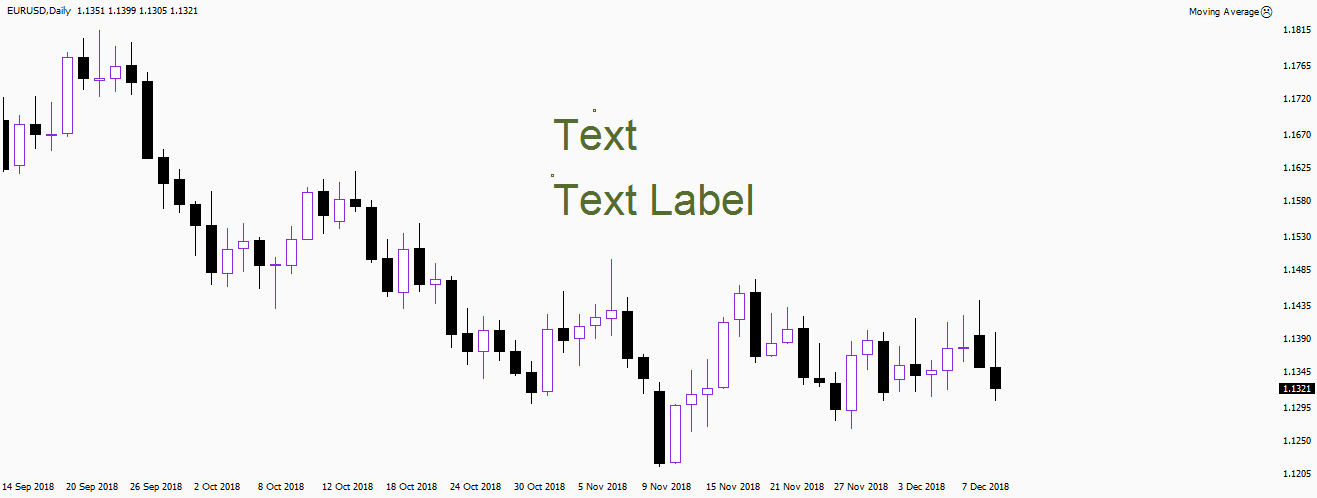
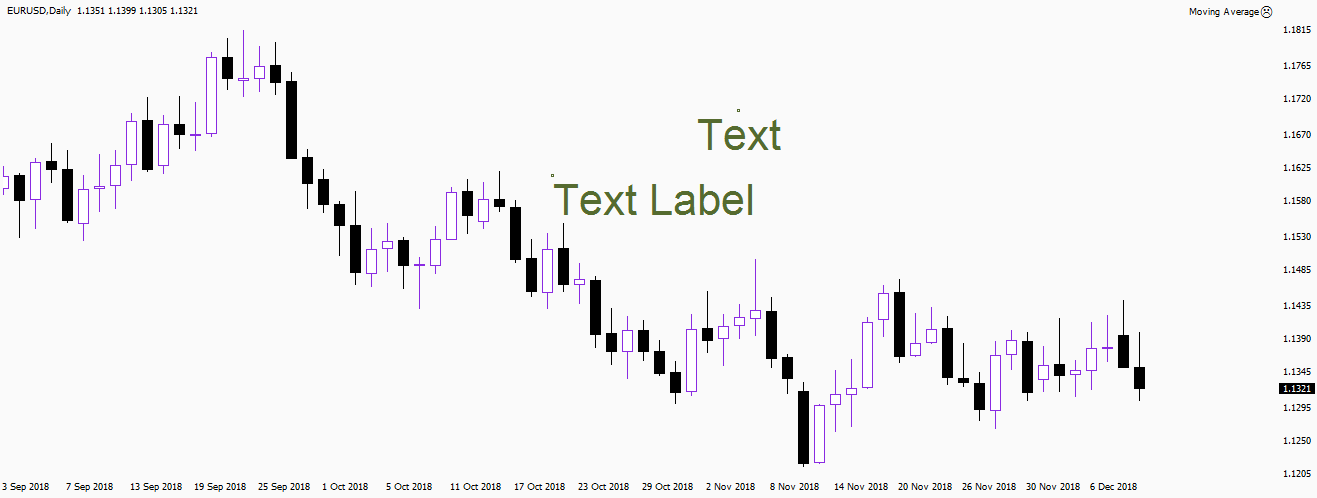
The Purpose of Forex Text Tagging
There is also a possibility to do text tagging. For this purpose, two tools are provided in terminal, which are “text” and “text labels”. Text and text labels look on chart exactly the same. But there is one important difference. Text moves together with chart, but text label stays in place, no matter how far you scroll chart. Double-clicking is used both to switch to edit mode and to exit this mode. In edit mode you can move objects or change the settings.