Excerpt: Reading a forex trading chart is an art. Don’t worry if you don’t know how to read forex trading chart. Learn the basics of chart reading with Forex4you’s tutorials.
If you want to make profits in forex market, you must understand how to read forex trading charts. In every trading platform, you can see the price of a FX pair in a table and also in a chart. As we all know, prices in forex market fluctuates too fast. Watching the currency pair price movement in a table is difficult to figure out its historic price movements. Therefore, those currently pair are also displayed in charts, so that traders can easily analyze the trend. Forex traders have developed various strategy to determine the movement of a currency pair. Fundamental traders usually read the latest economic news to obtain information about country’s interest rate, economic growth, unemployment rate, inflation, and the political condition of the country that can affect the high supply and demand of the currency. On the other hand, technical traders use tools on charts and indicators to identify the trends of currency prices and determine the key entry and exit points. In this article, we’ll explain in brief to how to read a Forex trading chart.
How to Read a Forex trading chart
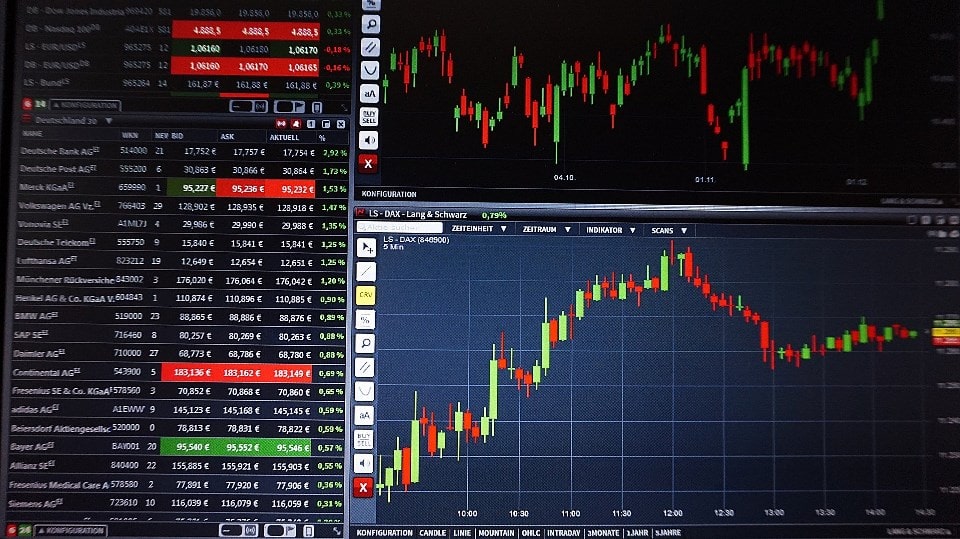
Knowing how to read a forex trading chart is the first step before you jump into real forex trading. As we all know, MT4 is the most popular forex trading platform and widely used. The MT4 chart will show you some available currency pairs in which each of them has a chart to check the price movements of a currency pair.
Candlestick Chart
There are three types of charts in an MT4 platform i.e. bar chart, candlesticks, and line chart. But the most commonly used chart is candlesticks chart. Candlestick chart displays the opening price, closing price, highest price, and the lowest price in a given time unit.
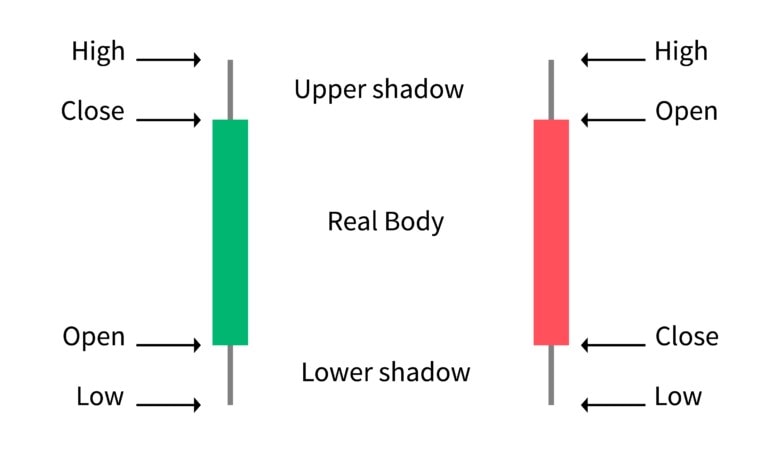
When the closing price is higher than the opening price, means that the price goes up and the candlestick chart shows blue. Conversely, when the closing price is lower than the opening price means that the falling price is depicted with a red-colored candle. Trading platform allows you to set the candlestick chart color on the properties menu of the MT4 chart.
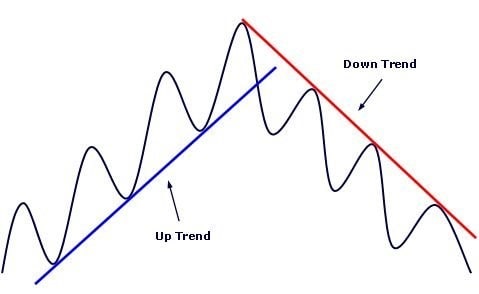
Drawing a Trend Line
There are three trends you can see in a chart of a currency price which are bullish, bearish, or flat. The trend line is used to help traders in recognizing the trend direction. To illustrate the trend line in charts you have to connect more than two highs or lows. If the next price does not penetrate the trend line, means that trend is most likely to continue.
There would be times when a price of forex pair tends to flat or sideways which is bouncing up and down in a certain period of time. In this condition, the price is usually consolidating to continue the trend or reverse the direction.
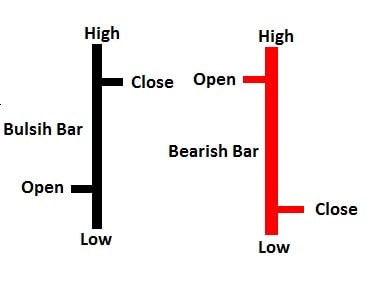
Bar Charts
A bar chart or OHLC shows the marks of the highest and lowest traded price, whilst the vertical graph indicates the overall trading range of the currency pair. The right-side horizontal line indicates the closing price point, whilst the left-right horizontal line indicates the opening price point, and the right-side horizontal line indicates the closing price point. A bar chart provides one period of time, which could be 1H, 1D, or 1W.