How Pivot Points Are Calculated?
The easiest way to calculate the Pivot is to use the following formula, which has been used on Wall Street for decades: you take the maximum price, the minimum and the closing price for a certain period, then the sum is divided by 3 (Pivot=(High + Low + Close) /3). This pivot point is then used to calculate three levels of support and resistance, which can be done by using the following classic formula:
R1 = Pivot + (Pivot – Low)
R2 = Pivot + (High – Low)
R3 = High + 2*(Pivot – Low)
S1 = Pivot - (High – Pivot)
S2 = Pivot - (High – Low)
S3 = Low - 2*(High – Pivot)
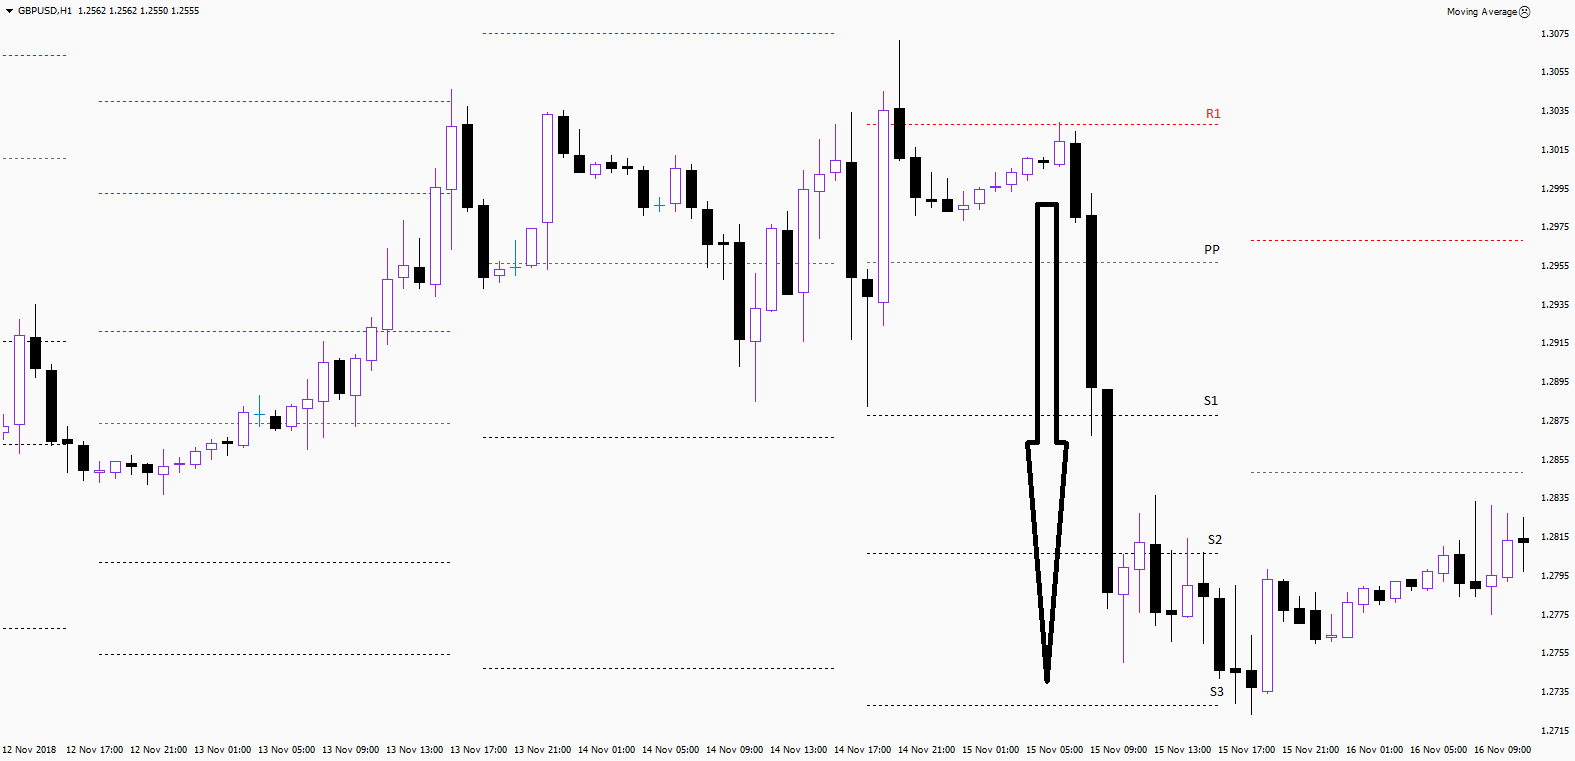
R1, R2, R3 are three zones of resistance.
S1, S2, S3 are three zones of support.
These zones are areas where close attention should be paid. For example, the price went up to S1, if there is no reversal, then you should wait for a reaction at S2. If the price moves further, then wait for S3.
What Should You Do with Pivot Points?
You should use Pivot Points as:
-
Zones of support and resistance;
-
Zones breakdown and pullbacks.
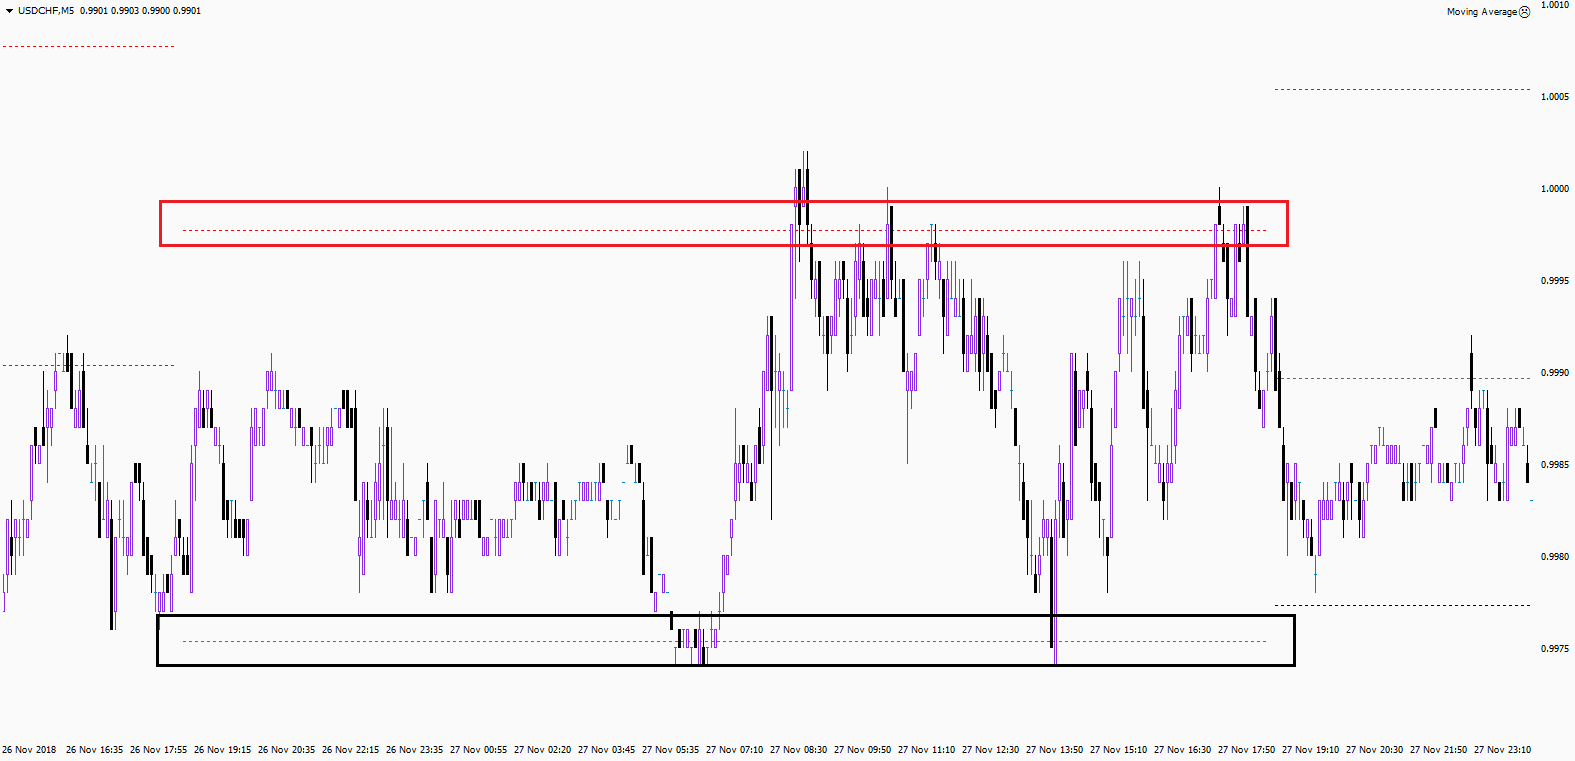
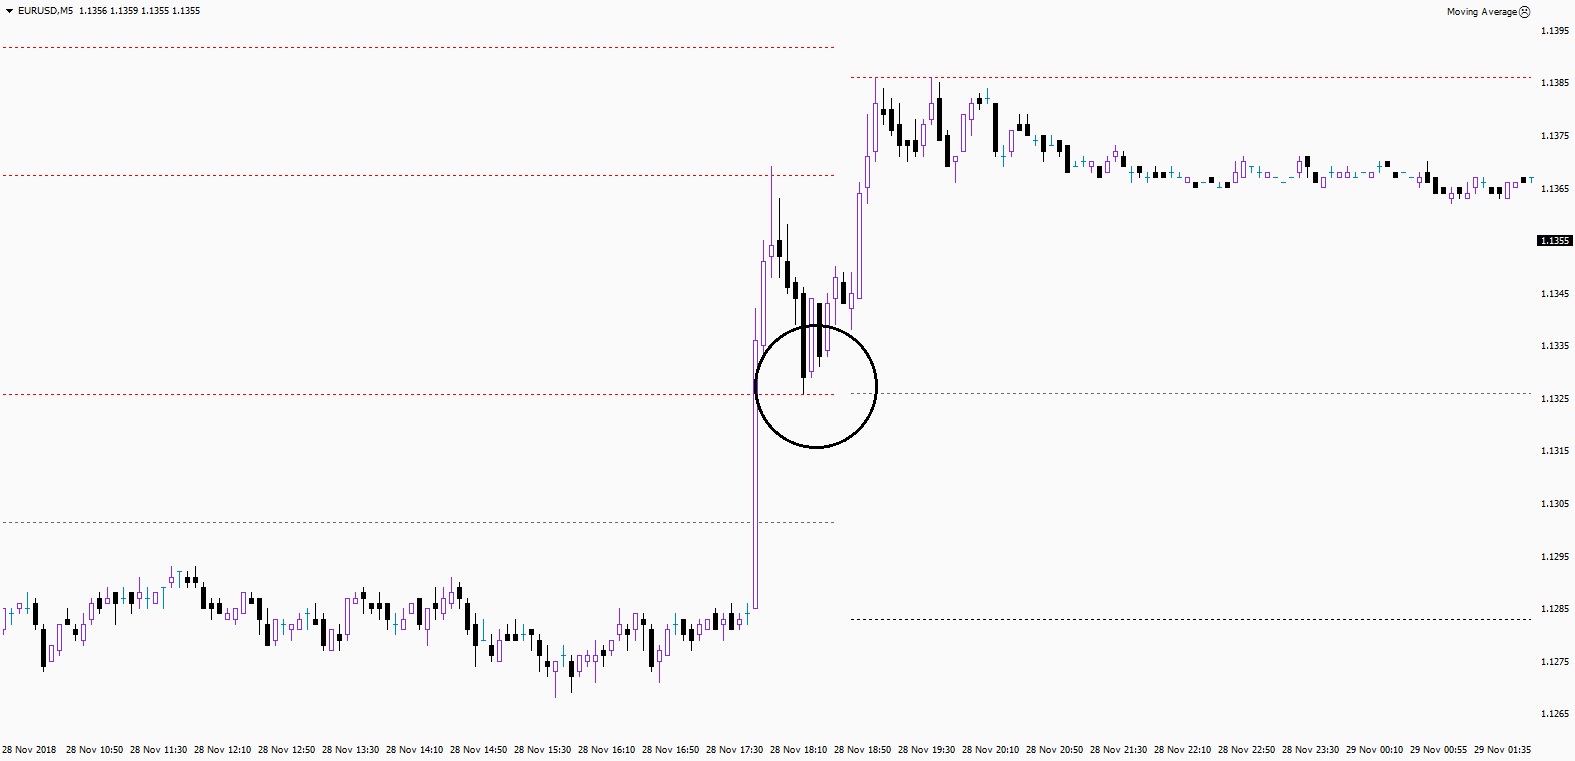
Pivot lines often form channels. After a false breakdown, a strong movement in the opposite direction can occur. This happens as a result of trading psychology. Fake breakdown (the entrance to the new trend, which did not happen) is a disappointment, after which the other side start to act. But after the real breakdown, the best option is not to enter immediately, but to wait for the rollback to support, which usually becomes a resistance.
Tip:
Opening a position on pullback after a real breakdown is one of the most successful options.
Pivot points are simply support and resistance levels, which are built automatically according to the formulas. The way traders are using it is exactly the same as with support/resistance. On one hand, automatically calculated pivot points take away the need to manually draw support and resistance levels. On the other hand, the formula remains a formula and therefore pivots do not replace, but rather complement the support/resistance levels, which are drawn manually.